



ASX 200 Morning Market Outlook: Woolworths (WOW) Set To Bounce?
Woolworths shows signs of stabilising after a steep sell-off, while the ASX 200 cooled as gold’s sharp decline weighed on materials and index sentiment.
Share this:

The ASX 200 pulled back on Wednesday as gold’s sharp sell-off rippled through the materials sector, dragging the broader index lower. However, energy and technology helped cushion losses, and Woolworths (WOW) may be showing the first technical signs of a recovery after weeks of sustained pressure.
View related analysis:
- Australian Dollar Consolidates: AUD/USD, EUR/AUD Near Pivotal Levels
- Gold Suffers Fifth Worst-Day Drop in 55yrs As Momentum Trade Unwinds
- ASX 200 Morning Market Outlook: ASX Hits Record High, Materials Lead
- ASX 200 Morning Market Outlook: Financials Lead Gains as CBA Rebounds
- ASX 200 Morning Market Outlook: Bad News Is Good News for ASX
Woolworths (WOW) Recovery Hopes Amid ASX 200 Sector Rotation
ASX 200 Market Snapshot
- The sharp drop in gold prices on Tuesday weighed on the broader ASX 200 index, which fell 0.7% on Wednesday.
- It was the most volatile session in four days, reinforcing the trend of Wednesdays being the liveliest trading day for the ASX 200 over the past three months.
- A two-bar reversal pattern (dark cloud cover) has now formed around the record high.
- Seven sectors declined, led by Materials (XMJ), which suffered its worst session in six months at –3.1%.
- Four sectors advanced, with Energy (XEJ) and Technology (XIJ) leading gains.
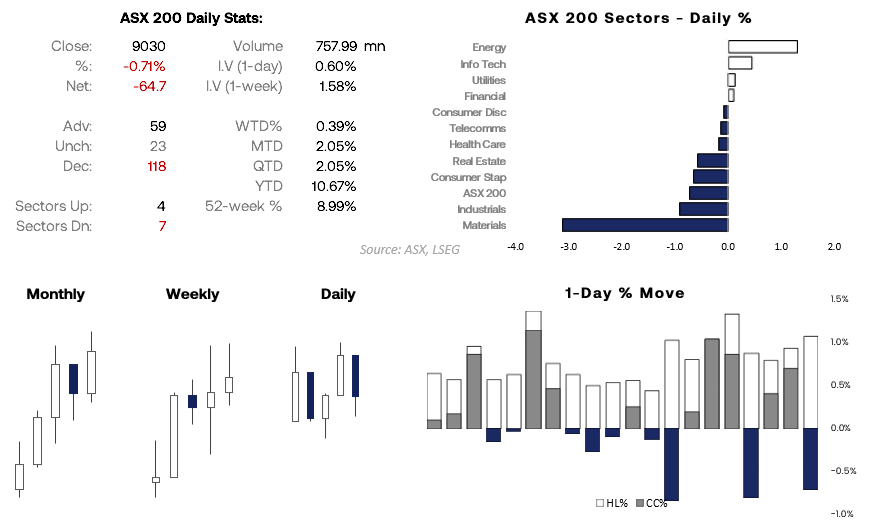
Chart analysis by Matt Simpson - source: ASX, LSEG
ASX 200 Sector Analysis
Most of the day’s moves on the ASX occurred at the open, though the materials sector managed to claw back some losses from its intraday low of –4%. Given the likely overreaction in gold after an extended rally, the retracement across materials may also prove limited — as may the sector’s bearish momentum relative to the broader ASX 200 index.
- The technology sector (XIJ) has formed a double bottom near 2800, signalling potential for at least a minor rebound.
- Industrials (XNJ) have rolled over just beneath the August high, suggesting scope for further weakness in the near term.
- Energy (XEJ) may have established a double bottom just above 8000, hinting at a possible rebound.
- While communication services (XTJ) printed a small doji, price action continues to suggest a meaningful low was seen last week, with dips favoured from here.
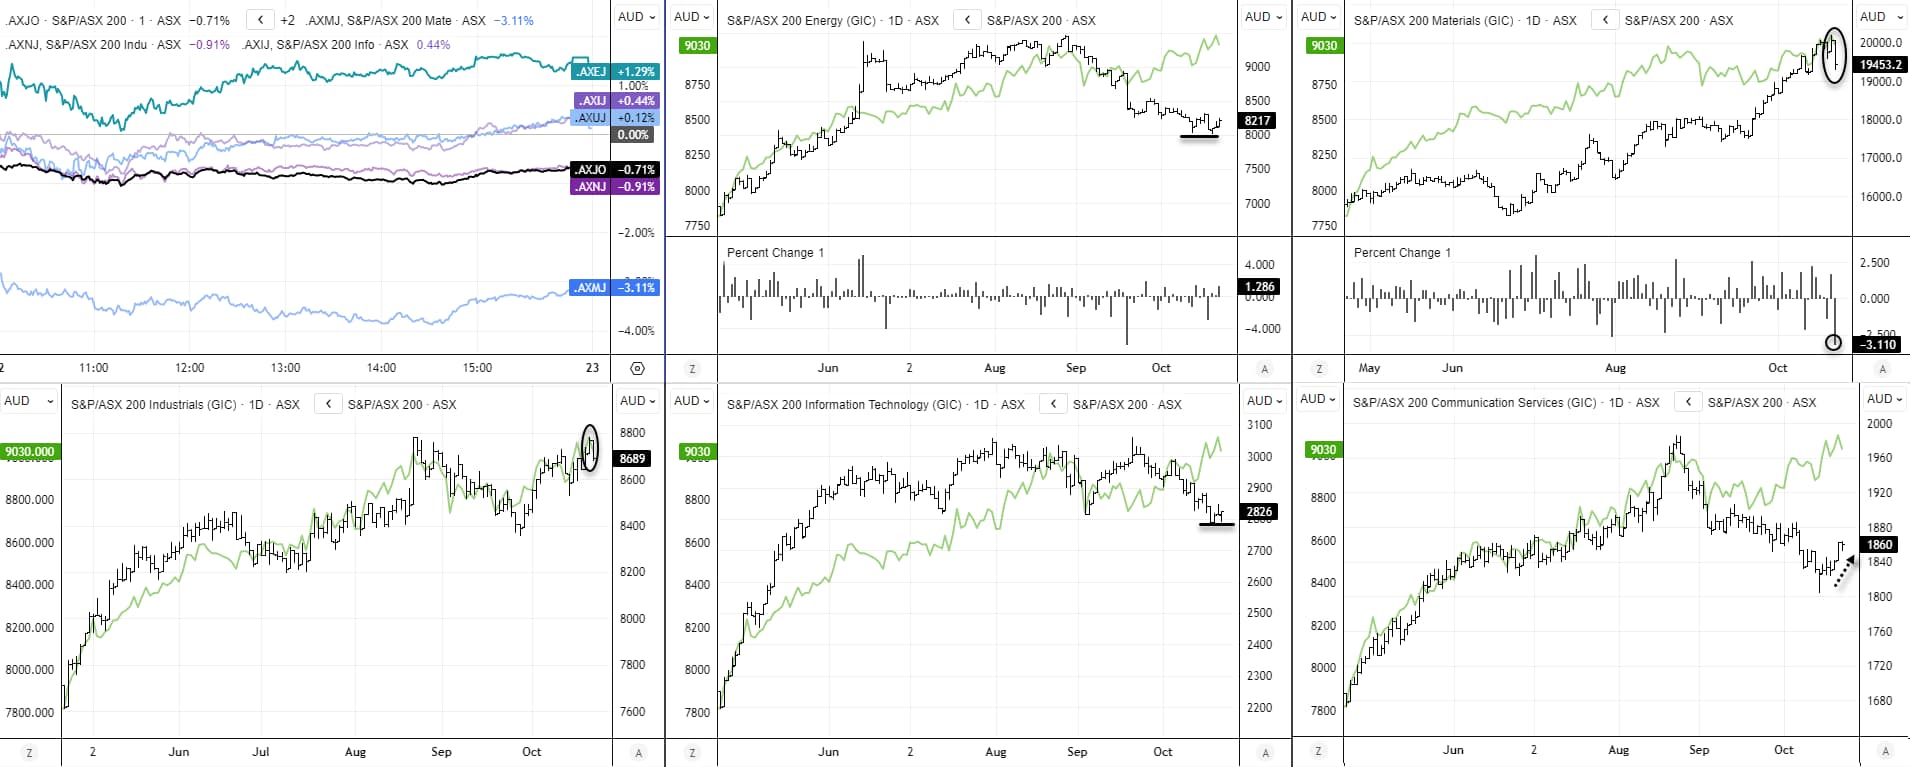

Chart analysis by Matt Simpson - source: ASX, LSEG


Woolworth Group (WOW) Technical Analysis
Woolworths fell 26% from its August high to the October low in just eight weeks, with 13% of that decline occurring in a single week. However, last week’s bullish engulfing candle above the May 2020 low signals early signs of stabilisation and potential mean reversion higher.
The daily chart shows a bullish RSI(14) divergence forming ahead of a bullish pinbar and range expansion candle, both supported by higher volume. With prices now consolidating around last week’s high, bulls may seek dips above the weekly pivot (26.35) for a retest of the March low near 27.00. A break above this level would assume a deeper retracement, bringing 28.00 into focus.
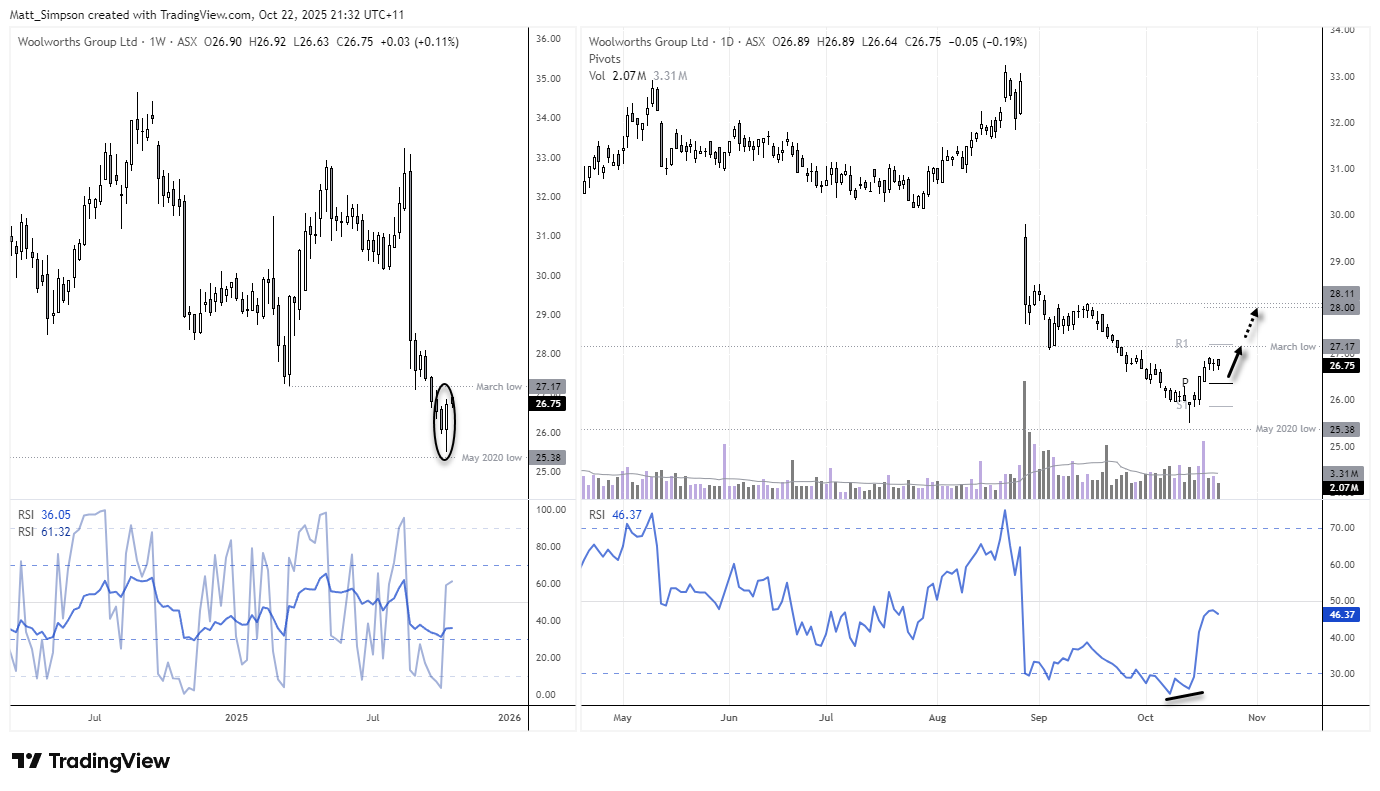
Chart analysis by Matt Simpson - source: Tradingview
View the full economic calendar
View the full economic calendar
-- Written by Matt Simpson
Follow Matt on Twitter @cLeverEdge
How to trade with City Index
You can trade with City Index by following these four easy steps:
- Open an account, or log in if you’re already a customer
• Open an account in the UK
• Open an account in Australia
• Open an account in Singapore
- Search for the market you want to trade in our award-winning platform
- Choose your position and size, and your stop and limit levels
- Place the trade
Related tags:
Latest market news




The complete CFD trading experience
Award-winning platforms, competitive spreads, low commissions and dedicated support.
We live and breathe the markets and are dedicated to helping traders realise their ambitions as we continue to set the industry bar.
Economic calendar
Web Trader platform
Our sophisticated web-based platform is packed with features.
Related articles
EUR/USD weekly outlook: FOMC and ECB to set the tone
The current backdrop is modestly bearish. On Friday, the EUR/USD closed modestly lower, down for the third consecutive day. The pair also posted a weekly decline after staging a modest recovery attempt in the previous week. Out of the past 8 weeks, the EUR/USD has fallen on 6 occasions. There is not much supporting factors for the single currency right now. So, the upside remains capped.


Silver forecast: metals liquidation drags XAG/USD into $50-55 support
Silver has broken its July low and slipped into a long-term support zone as the selling in precious metals deepens. The chart shows where the metal could bottom, and next week's Fed decision may decide whether it does.

S&P 500 forecast: AI linked stocks remain under pressure
And just like that, it is Friday again and the end of a volatile week. Today offers little on the macro calendar to change the prevailing narrative, leaving markets largely at the mercy of risk appetite, oil prices and the growing unease around the AI trade.
StoneX Europe Ltd may make third party material available on this website which may contain information included but not limited to the conditions of financial markets. The material is for information purposes only and does not contain, and should not be construed as containing, investment advice and/or investment recommendation and/or an investment research and/or an offer of or solicitation for any transactions in financial instruments; any decision to enter into a specific transaction shall be made by the client following an assessment by him/her of their situation.
StoneX Europe Ltd makes no representation or warranty and assumes no liability as to the accuracy or completeness of the information provided, nor any loss arising from any investment based on a recommendation, forecast or other information supplied. You should always seek independent advice as to your suitability to speculate in any related markets and your ability to assume the associated risks, if you are at all unsure. We are not under any obligation to update any such material. Any opinion made may be personal to the author and may not reflect the opinion of StoneX Europe Ltd.