



ASX 200 Outlook: CSL, COH, Drag Healthcare and ASX Lower
Healthcare stocks slump as Cochlear plunges, dragging the ASX 200 lower despite easing geopolitical tensions.
Share this:

The ASX 200 has slipped into a more defensive tone, with healthcare stocks driving a sharp selloff despite an extension to the Iran ceasefire. A steep decline in Cochlear (COH) weighed heavily on the broader index, raising questions about whether the market is entering a deeper pullback or simply pausing before its next move higher.
View related analysis:
View related analysis:
ASX 200 Outlook: CSL, COH Drag Healthcare and ASX Lower
ASX 200 Market Snapshot
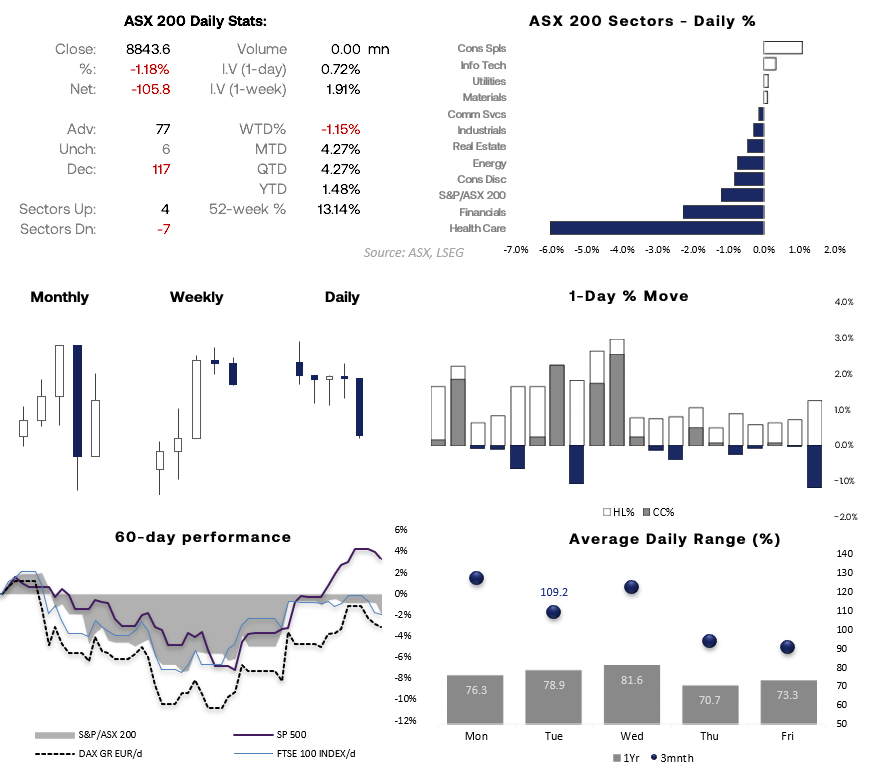
- The ASX 200 fell -1.2% on Wednesday, despite the US announcing an indefinite extension to the Iran ceasefire
- The day’s range of 1.25% marked its most volatile session in two weeks, pushing the index into a clearer corrective phase
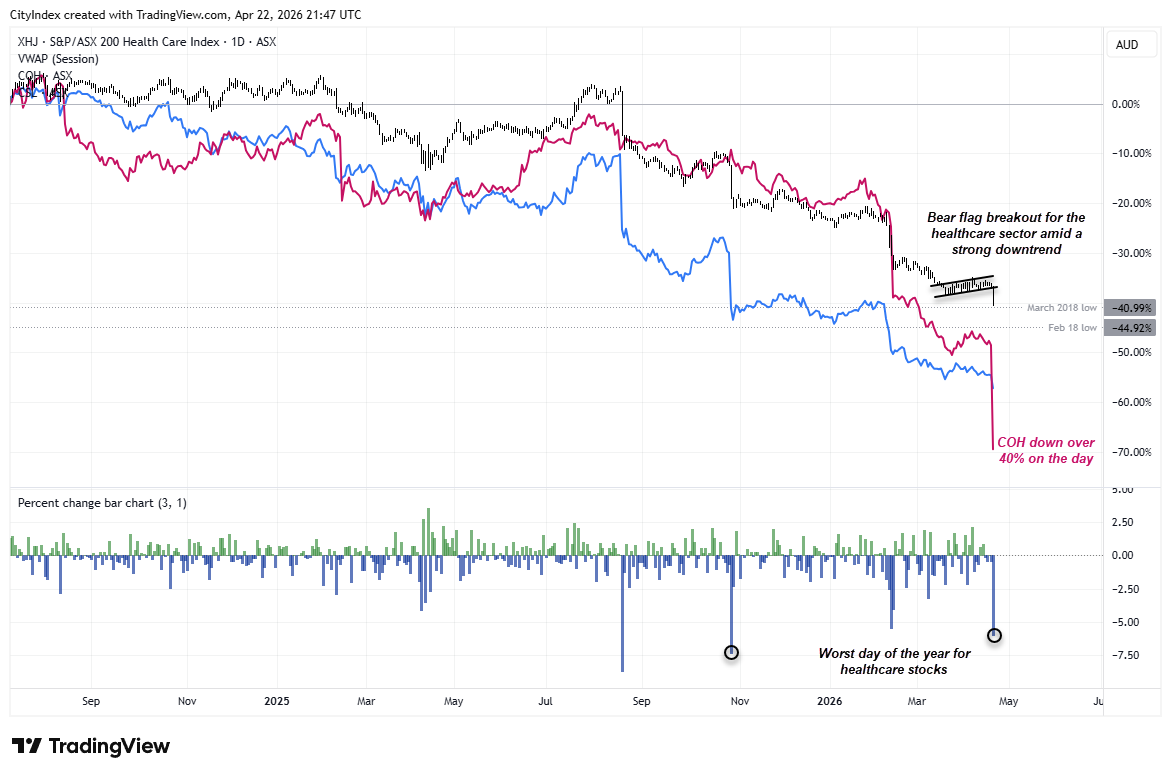
- Healthcare (XHJ) led seven sectors lower, falling -6% in its worst session since October. Cochlear (COH) plunged -40.7%, Global Health (GLH) fell -12.8%, and CSL (CSL) declined -5.7%
- Financials (XFJ) also fell -2.2%, with CBA (CBA) down -2.5%, leading the Big Four lower
- Consumer staples (XSJ) rallied for a third consecutive session, closing at their highest level since August 2023, with Woolworths (WOW) and Coles (COL) rising 0.9% and 0.4% respectively
- Volatility typically eases into the end of the week, based on 3-month and 1-year averages
Source: ASX, LSEG


Healthcare Sector Breaks Down as Selling Accelerates
The ASX healthcare sector (XHJ) has taken a decisive turn lower, breaking down from a bear flag pattern within an established downtrend — a classic continuation signal. The move has been led by Cochlear (COH), which plunged more than 40% in a single session, dragging the broader sector sharply lower. Relative performance has also deteriorated against the wider market, highlighting clear capital rotation away from healthcare.
Ultimately, this looks like a bearish trend breakdown, and rallies in names such as CSL (CSL) and Ramsay Health Care (RHC) may continue to be sold unless the sector can reclaim key support levels.
Source: ASX, LSEG
ASX 200 Technical Analysis
ASX 200 Range Holds as 9000 Caps Upside and 8900 Acts as Key Pivot
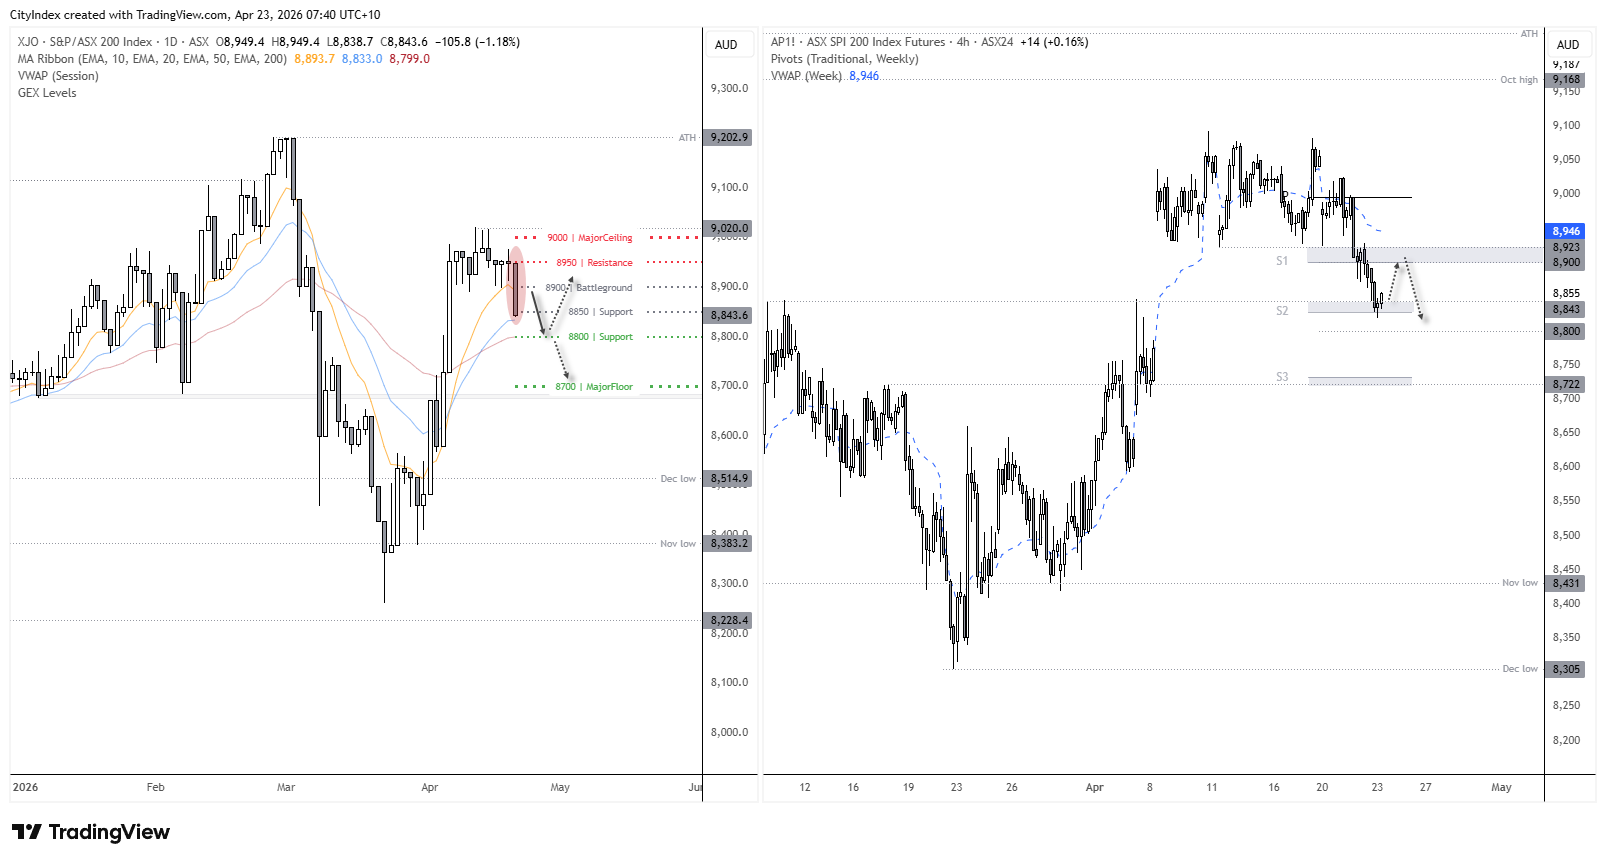
Options positioning shows the ASX 200 remains within a defined trading range, with key levels clustering around current price. The 8900 area is the main battleground, where price may continue to consolidate. Above, 8950–9000 forms a resistance zone, where rallies are likely to slow. On the downside, 8800 provides initial support, with 8700 acting as a stronger floor if selling pressure builds.
In a nutshell: Expect range-bound conditions, with chop around 8900, resistance near 9000, and support layered below 8800.
Momentum Turns Lower as 8900 Resistance Caps Near-Term Upside
The daily chart shows momentum has turned against the prior rally, following a tight consolidation near cycle highs. The 50-day EMA sits around 8800, making it a viable near-term downside target for bears.
However, SPI 200 (ASX 200) futures attempted to build support above the March 11 high and weekly S2 pivot point overnight, leaving scope for a near-term bounce. That said, resistance around weekly S1 pivot and 8900–8923 zone may attract sellers, particularly as it sits well below the weekly VWAP, which is now curling lower.
Source: ASX, TradingView
View the full economic calendar
View the full economic calendar
-- Written by Matt Simpson
Follow Matt on Twitter @cLeverEdge
How to trade with City Index
You can trade with City Index by following these four easy steps:
- Open an account, or log in if you’re already a customer
• Open an account in the UK
• Open an account in Australia
• Open an account in Singapore
- Search for the market you want to trade in our award-winning platform
- Choose your position and size, and your stop and limit levels
- Place the trade
Related tags:


The complete CFD trading experience
Award-winning platforms, competitive spreads, low commissions and dedicated support.
We live and breathe the markets and are dedicated to helping traders realise their ambitions as we continue to set the industry bar.
Economic calendar
Web Trader platform
Our sophisticated web-based platform is packed with features.
Related articles
Nikkei swings harder than Nasdaq as AI fears deepen
Nikkei 225 volatility is running well ahead of Nasdaq 100, with the index construction and Japan's heavy exposure to AI manufacturing potentially explaining the difference.

Forex & Gold Outlook: Dollar Dominates, Crosses Diverge
The US dollar rally gathers momentum as forex crosses develop contrasting technical setups. Matt Simpson examines eight FX markets and gold for potential trading opportunities.

Gold Outlook: Asia Buys the Dip, US Hammers the Rip
Asia buys the dip, the US sells the rip. Hourly gold, dollar and Treasury yield data reveal a regional divide that has become especially pronounced since September.
StoneX Europe Ltd may make third party material available on this website which may contain information included but not limited to the conditions of financial markets. The material is for information purposes only and does not contain, and should not be construed as containing, investment advice and/or investment recommendation and/or an investment research and/or an offer of or solicitation for any transactions in financial instruments; any decision to enter into a specific transaction shall be made by the client following an assessment by him/her of their situation.
StoneX Europe Ltd makes no representation or warranty and assumes no liability as to the accuracy or completeness of the information provided, nor any loss arising from any investment based on a recommendation, forecast or other information supplied. You should always seek independent advice as to your suitability to speculate in any related markets and your ability to assume the associated risks, if you are at all unsure. We are not under any obligation to update any such material. Any opinion made may be personal to the author and may not reflect the opinion of StoneX Europe Ltd.