



ASX 200 Outlook: Qantas, Brambles and ALS Highlight Mixed Signals
The ASX 200 lags Wall Street as sector rotation masks weakening momentum, with Industrials hinting at a base while futures face resistance near 8,800.
Share this:

The ASX 200 continues to underperform global peers, with narrow gains masking growing internal divergence. While Materials pushed to fresh highs and Industrials hinted at near-term stabilisation, weakness in Energy and broader index price action suggest upside momentum remains fragile as traders assess RBA risks and broader global sentiment.
View related analysis:
View related analysis:
ASX 200 Outlook: Momentum Falters as Key Levels Loom
ASX 200 Market Snapshot
- While 137 ASX 200 stocks (65.5%) advanced on Wednesday, the index rose just 0.15% by the close
- The Materials sector (XMJ) rose for a third consecutive session to print a fresh record high, leading eight ASX sectors higher on the day, while three sectors declined — led by Energy (XEJ)
- Lower crude oil prices saw the ASX Energy sector suffer its worst session in 30 trading days
- The day’s high met resistance near the September low (8731.3) and closed near the lows of Tuesday’s bearish engulfing candle, suggesting bulls may be running out of ideas
- A bullish engulfing candle formed above the September low on the ASX Industrials index (XNJ), while Qantas Airways (QAN) and Brambles (BXB) hint at swing lows and ALS eyes a potential bullish breakout
- The Australian share market has also failed to rise alongside Wall Street peers, raising questions over whether the rally from the November low has already run its course after topping in late December
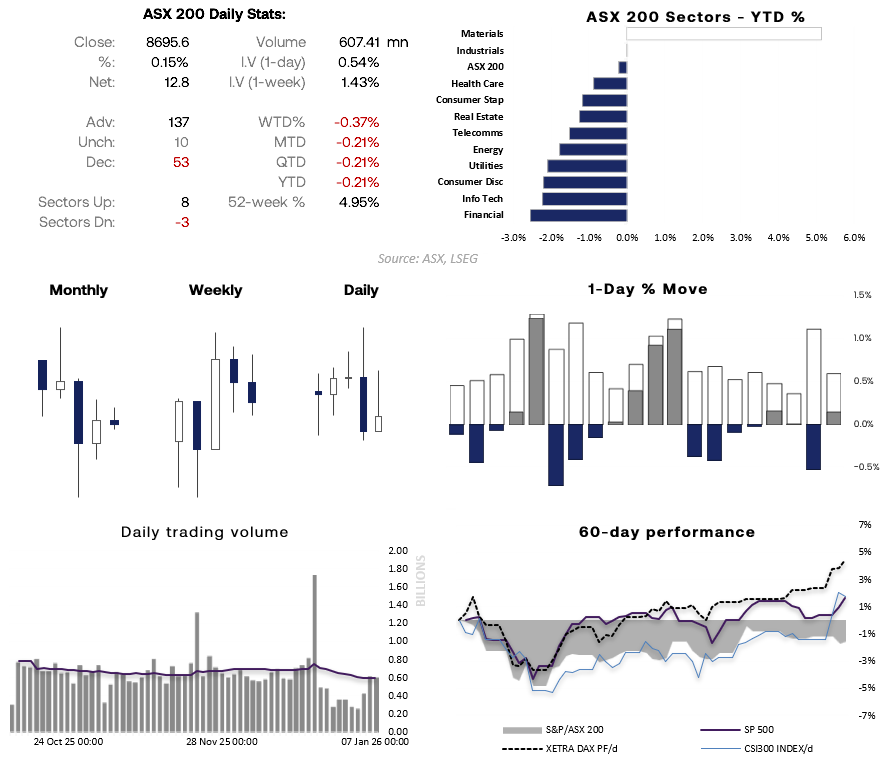
Chart analysis by Matt Simpson - source: ASX, LSEG


ASX Industrials Signal a Near-Term Base
The bullish engulfing day for the ASX Industrials index on Wednesday formed at its 200-day SMA and September low. While this does not guarantee a strong rally, it is at least a cautionary tale for bears and suggests bulls may begin to seek bullish setups across some sector stocks.
Brambles (BXB) remains within a bearish channel, although prices are holding above the lower trendline and have closed back above the August low. A bullish mean-reversion move towards the 20-day EMA, the $30 handle, or even the 50-day EMA could be on the horizon.
Qantas (QAN) formed a bullish engulfing candle at the 20- and 50-day EMAs. While the uptrend is not particularly strong, price action continues to grind higher on the daily chart, and Wednesday’s move hints at an interim swing low.
ALS (ALQ) is hinting at a bullish breakout. The stock remains firmly within a broader uptrend, with a potential inverted head-and-shoulders pattern forming — typically a continuation pattern during a trend.
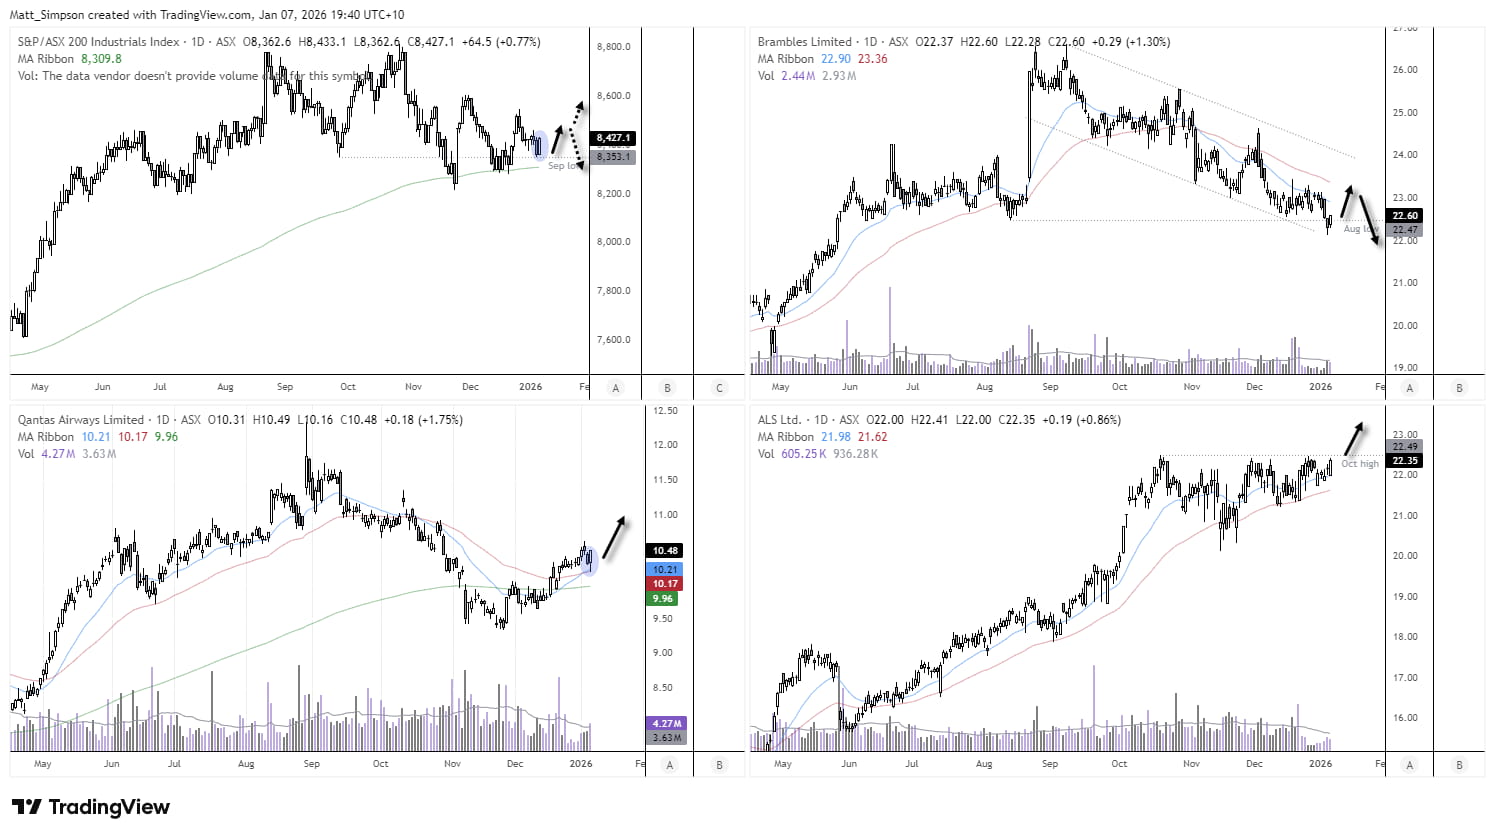
Chart analysis by Matt Simpson - source: ASX, TradingView
ASX 200 Technical Analysis
The Australian share market continues to lag Wall Street and, despite rebounding from its November low, remains well below record highs. Expectations that the RBA may hold rates higher for longer — and the small but non-zero risk of a hike — continue to dampen risk appetite. Should global risk sentiment deteriorate, the ASX appears vulnerable to underperform US equities.
ASX 200 futures are holding above the monthly pivot point for now, although Tuesday’s bearish engulfing candle warns of a fragile market. Wednesday’s inverted hammer allowed for a modest bounce, but bears may look to fade minor rallies below the 8,800 handle, near the monthly R1 pivot and November VPOC.
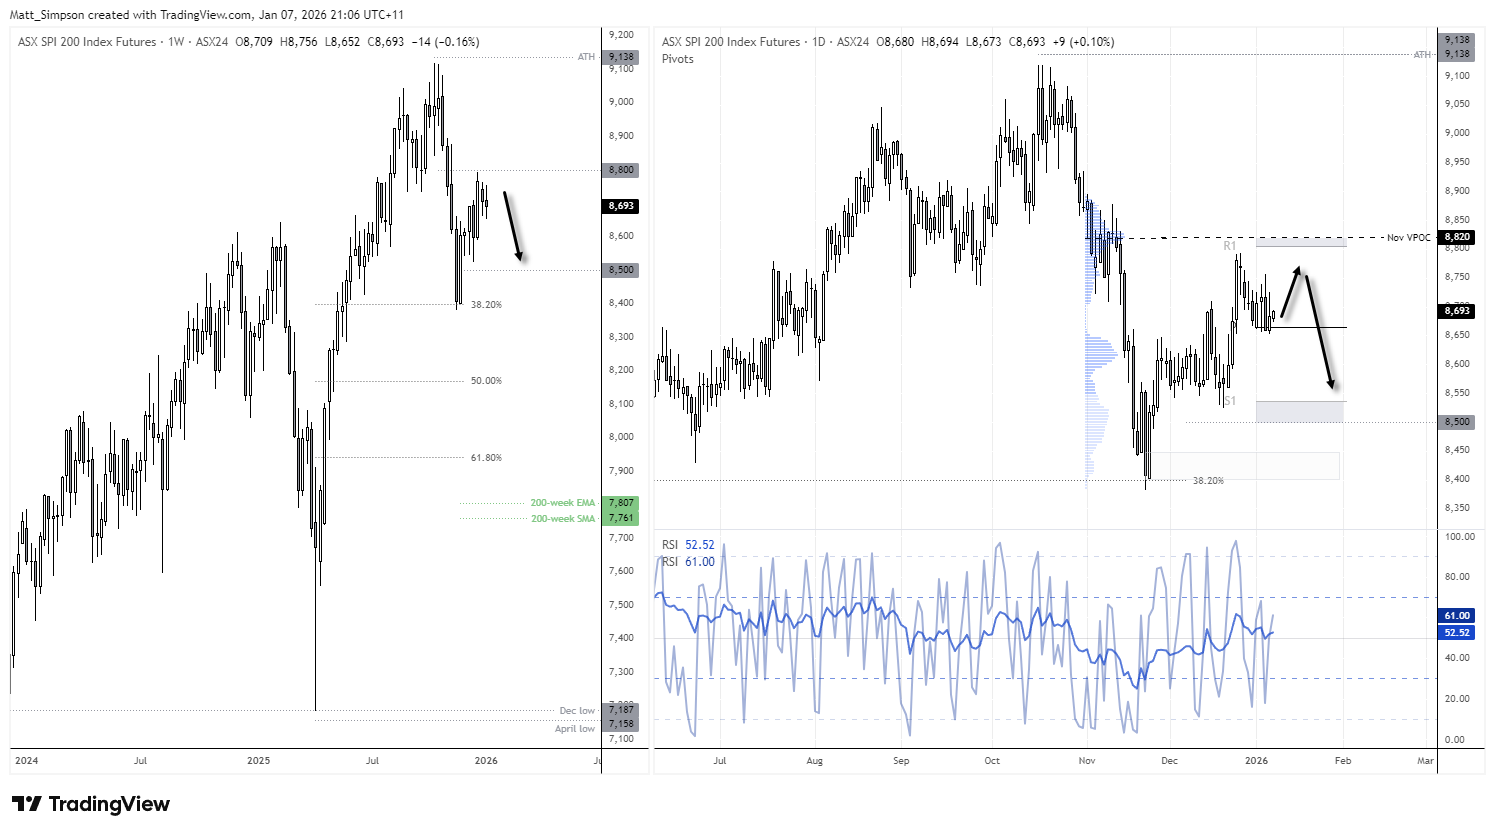
Chart analysis by Matt Simpson - Source: TradingView, ASX SPI 200 Index Futures
View the full economic calendar
View the full economic calendar
-- Written by Matt Simpson
Follow Matt on Twitter @cLeverEdge
How to trade with City Index
You can trade with City Index by following these four easy steps:
- Open an account, or log in if you’re already a customer
• Open an account in the UK
• Open an account in Australia
• Open an account in Singapore
- Search for the market you want to trade in our award-winning platform
- Choose your position and size, and your stop and limit levels
- Place the trade
Related tags:



The complete CFD trading experience
Award-winning platforms, competitive spreads, low commissions and dedicated support.
We live and breathe the markets and are dedicated to helping traders realise their ambitions as we continue to set the industry bar.
Economic calendar
Web Trader platform
Our sophisticated web-based platform is packed with features.
Related articles

Dow Jones forecast: Stock markets under pressure from multiple sources
When looking at the major tech-heavy US indices like the S&P 500 or the Nasdaq 100, you wouldn’t think that the stock market is particularly weak. Yet, beneath the surface, the market is far from healthy right now. Investors are evidently just piling into the big tech and AI names, and as a result, market breadth is deteriorating. Other indices like the small cap Russell 2000 and the Dow Jones are starting to reflect that weakness.


Nikkei breakout accelerates as yen weakness returns
Nikkei has started October with a powerful breakout, helped by renewed yen weakness and strong upside momentum


S&P 500 Forecast: SPX Continues to Drift Away from Record Highs
Recent trading sessions have done little to restore confidence in the equity market. Over the last four sessions, the S&P 500 has declined by nearly 1.00%, a move that highlights growing short-term weakness and keeps the index moving further away from its record-high territory.

StoneX Europe Ltd may make third party material available on this website which may contain information included but not limited to the conditions of financial markets. The material is for information purposes only and does not contain, and should not be construed as containing, investment advice and/or investment recommendation and/or an investment research and/or an offer of or solicitation for any transactions in financial instruments; any decision to enter into a specific transaction shall be made by the client following an assessment by him/her of their situation.
StoneX Europe Ltd makes no representation or warranty and assumes no liability as to the accuracy or completeness of the information provided, nor any loss arising from any investment based on a recommendation, forecast or other information supplied. You should always seek independent advice as to your suitability to speculate in any related markets and your ability to assume the associated risks, if you are at all unsure. We are not under any obligation to update any such material. Any opinion made may be personal to the author and may not reflect the opinion of StoneX Europe Ltd.