



AUD/JPY Outlook: Reversal Clues Threaten the Mighty Aussie Yen Trend
AUD/JPY shows bearish divergence near historic resistance as the Aussie yen rally stalls. Are 107 and 106 the next downside targets?
Share this:

Every so often we hear phrases such as “everything is in the price”, implying a technical analyst does not need to know anything else about a market to make a call. It can be slightly misleading, however, because a supposed reversal pattern – such as a doji near resistance – can quickly be invalidated by fresh news powerful enough to shift sentiment.
That said, there are times when enough technical clues align to justify a ‘punt’, even if the catalyst is not immediately obvious. I believe AUD/JPY ticks that box today.
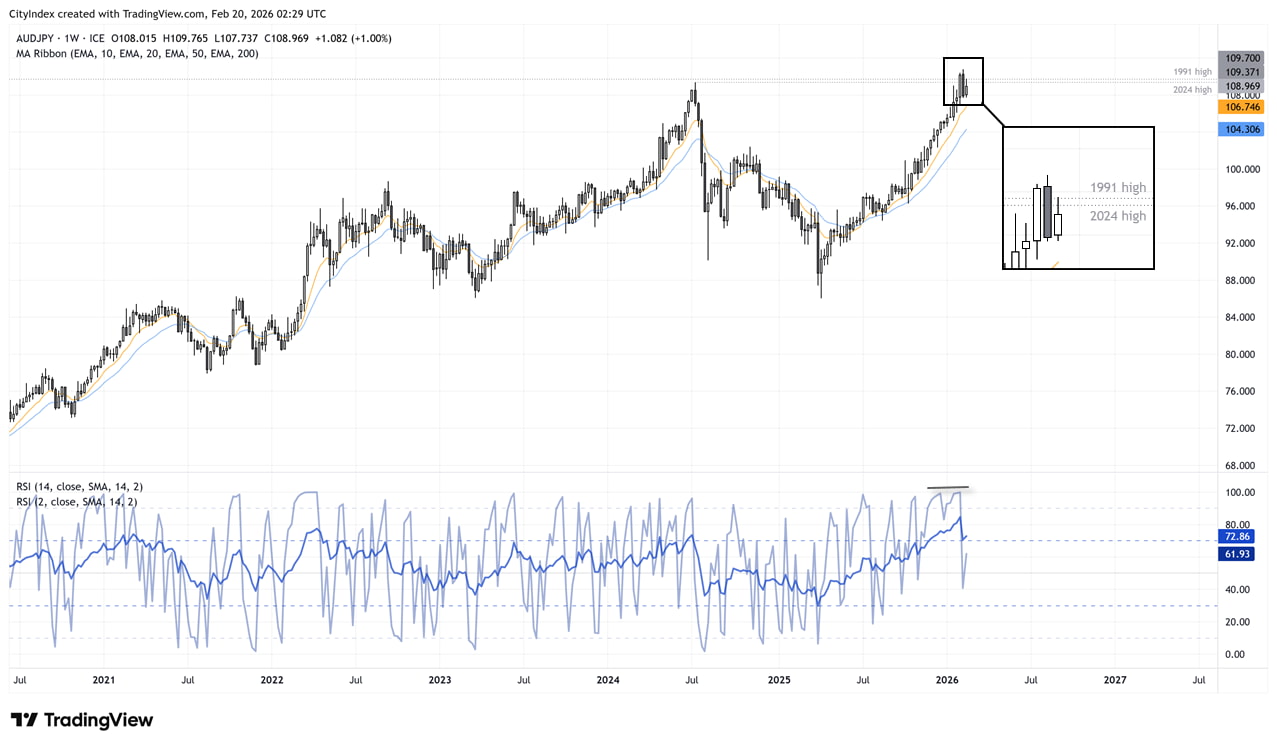
A quick glance at the weekly chart shows that AUD/JPY has staged an outstanding rally since April, when Trump watered down many of his tariffs and struck deals with trade partners. The Australian dollar vs Japanese yen cross has rallied more than 28% since then, largely in a straight line. However, cracks are beginning to emerge in the uptrend, and it could be time for at least a modest pullback.
View related analysis:
View related analysis:


AUD/JPY Technical Analysis: Australian Dollar vs Japanese Yen
AUD/JPY weekly chart signals bearish reversal near major historical resistance
A two-bar reversal (dark cloud cover) has formed on the weekly chart around the 2024 and 1991 highs. The fact that we saw a weekly close beneath both of these historical resistance levels appears significant. This week’s high has also respected the 1991 high as resistance, strengthening the case that a retracement may be unfolding.
Furthermore, prices are extended from their 10- and 20-week EMAs, while RSI (2) shows bearish divergence. RSI (14) is also turning lower from extremely overbought territory — another warning sign that upside momentum may be fading.
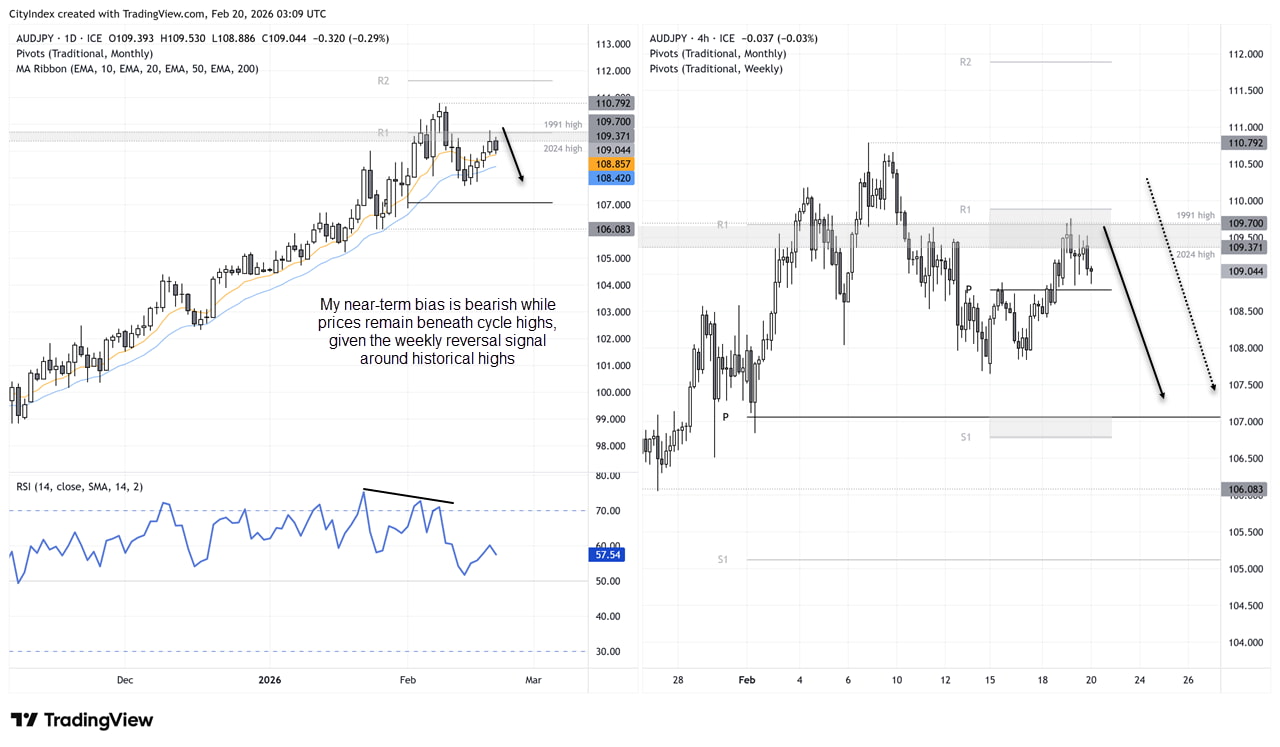
The daily chart show that Thursday’s high respected the monthly R1 pivot as resistance, and the 4-hour also shows the weekly R1 pivot nearby. The daily RSI (14) displayed a bearish divergence ahead of its recent top, and prices are now hinting at a cycle high around resistance – after a 4-day rally.
Source: ICE, TradingView
AUD/JPY price action tests pivot resistance as bearish momentum builds on daily and 4-hour charts
On the daily chart, Thursday’s high respected the monthly R1 pivot as resistance, with the weekly R1 pivot also nearby on the 4-hour timeframe. The daily RSI (14) displayed bearish divergence ahead of the recent high, and price action is now hinting at a potential cycle high near resistance following a four-day rally.
I cannot say with certainty whether we have seen the high for the week. However, given the weekly reversal pattern around major historical resistance, combined with monthly and weekly pivot resistance and bearish RSI divergence, bears may be tempted to fade rallies while AUD/JPY remains below 111.
With momentum turning lower on the 4-hour chart ahead of the weekend, the invalidation level could potentially be lowered towards 110. The 107 handle houses the monthly pivot point, making it a viable downside target for bears. A break beneath 107 would then bring the 106 handle into focus.
Source: ICE, TradingView
Related tags:
Latest market news




The complete CFD trading experience
Award-winning platforms, competitive spreads, low commissions and dedicated support.
We live and breathe the markets and are dedicated to helping traders realise their ambitions as we continue to set the industry bar.
Economic calendar
Web Trader platform
Our sophisticated web-based platform is packed with features.
Related articles
EUR/USD weekly outlook: FOMC and ECB to set the tone
The current backdrop is modestly bearish. On Friday, the EUR/USD closed modestly lower, down for the third consecutive day. The pair also posted a weekly decline after staging a modest recovery attempt in the previous week. Out of the past 8 weeks, the EUR/USD has fallen on 6 occasions. There is not much supporting factors for the single currency right now. So, the upside remains capped.

USD/JPY Forecast: Is Rising Japanese Inflation Supporting the Yen?
As the trading week comes to an end, one of the most relevant developments in the FX market has been the renewed strength of the Japanese yen. This can be seen in the recent performance of USD/JPY, which has fallen nearly 1.0% over the last two trading sessions, highlighting a meaningful recovery in the Japanese currency against the U.S. dollar.


Silver forecast: metals liquidation drags XAG/USD into $50-55 support
Silver has broken its July low and slipped into a long-term support zone as the selling in precious metals deepens. The chart shows where the metal could bottom, and next week's Fed decision may decide whether it does.
StoneX Europe Ltd may make third party material available on this website which may contain information included but not limited to the conditions of financial markets. The material is for information purposes only and does not contain, and should not be construed as containing, investment advice and/or investment recommendation and/or an investment research and/or an offer of or solicitation for any transactions in financial instruments; any decision to enter into a specific transaction shall be made by the client following an assessment by him/her of their situation.
StoneX Europe Ltd makes no representation or warranty and assumes no liability as to the accuracy or completeness of the information provided, nor any loss arising from any investment based on a recommendation, forecast or other information supplied. You should always seek independent advice as to your suitability to speculate in any related markets and your ability to assume the associated risks, if you are at all unsure. We are not under any obligation to update any such material. Any opinion made may be personal to the author and may not reflect the opinion of StoneX Europe Ltd.