







AUD/JPY Risks Breakdown as Momentum Fades Below 95.00 Resistance
The Australian dollar is under pressure against the Japanese yen as bullish momentum stalls near key resistance, highlighting downside risks for AUD/JPY.
Share this:
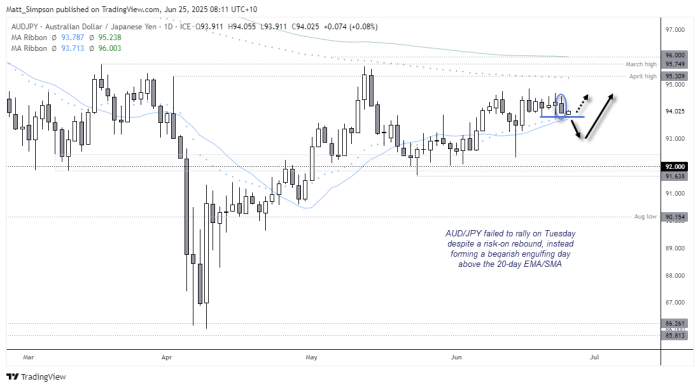
The Australian dollar is struggling to maintain upward momentum against the Japanese yen, with AUD/JPY failing to follow through on a bullish setup despite a broader risk-on rebound. After carving out a bullish hammer and range expansion above 92.00 last week, bulls were eyeing a move toward 95.50 and 96.00. Yet, recent price action has turned cautious. Tuesday’s bearish engulfing candle and a failure to hold gains above the 20-day EMA and SMA suggest bearish pressure is building. A downside break beneath 93.70 could expose deeper support levels as short-term sentiment shifts.
View related analysis:
View related analysis:
AUD/JPY Technical Analysis: Australian Dollar vs Japanese Yen
Last week, I outlined a bullish bias for AUD/JPY, targeting a move towards 95.50 and 96.00. The bullish hammer above 92.00 and subsequent bullish range expansion day looked promising—especially with an inverted head and shoulders (H&S) pattern forming on the 1-hour chart. However, four days later, bullish momentum has failed to follow through, and Japanese yen bears may now have a slight upper hand over the Australian dollar.
The daily chart for AUD/JPY shows a small bearish engulfing candle forming on Tuesday, following a wide-legged Doji that signalled elevated volatility within the recent sideways range. This pattern has ultimately resolved with a dip lower. The failure of AUD/JPY to rally during a broader risk-on rebound also raises a red flag, and puts a potential downside break firmly on the radar.
A break beneath 93.70 would see prices beneath its recent range and also clear the 20-day SMA and EMA to suggest a countertrend move is on the cards.
AUD/JPY Technical Analysis: 1-Hour Chart
The 1-hour chart shows AUD/JPY has been oscillating between the 93.80–94.75 zone over the past week. Prices have drifted toward the lower bounds of that range, though AUD/JPY is attempting to carve out a swing low above the 38.2% Fibonacci retracement level.
Given the 1-hour RSI (2) reached an extremely oversold reading of 3.2 overnight, the bias is for a minor bounce before prices potentially break lower from the range. Bears could look to fade into intraday rallies if a swing high appears to form on the 1-hour chart.

Economic Events in Focus (AEST / GMT+10)
08:00 NZD Trade Balance (May), Exports, Imports (NZD/USD, NZX 50)
09:50 JPY BoJ Summary of Opinions, Corporate Services Price Index (CSPI) (YoY) (USD/JPY, Nikkei 225)
10:15 USD Fed Schmid Speaks (USD, S&P 500, Nasdaq 100, Dow Jones, Gold, Crude Oil)
11:00 JPY BoJ Tamura Speaks (USD/JPY, Nikkei 225)
11:30 AUD Weighted Mean CPI (YoY) (May) (AUD/USD, ASX 200)
14:00 GBP Car Registration (MoM, YoY) (May) (GBP/USD, FTSE 100)
14:00 EUR German Car Registration (MoM, YoY) (May) (EUR/USD, DAX)
15:00 JPY Leading Index, Coincident Indicator (Apr) (USD/JPY, Nikkei 225)
18:00 CHF ZEW Expectations (Jun) (USD/CHF, SMI)
19:00 GBP 15-Year Treasury Gilt Auction (GBP/USD, FTSE 100)
21:00 USD MBA Mortgage Applications, Refinance Index, Purchase Index, Market Index, 30-Year Mortgage Rate (USD, S&P 500, Nasdaq 100, Dow Jones)
22:30 USD Building Permits (May) (USD, S&P 500, Nasdaq 100, Dow Jones, Gold, Crude Oil)
23:00 CHF SNB Quarterly Bulletin (USD/CHF, SMI)
00:00 USD Fed Chair Powell Testifies, New Home Sales (May) (USD, S&P 500, Nasdaq 100, Dow Jones)
00:30 USD Crude Oil Inventories, EIA Stockpiles, Refinery Runs, Gasoline & Heating Oil Data (USD, Crude Oil, S&P 500)
01:00 CAD Budget Balance (Apr) (USD/CAD, TSX)
02:00 USD 5-Year Note Auction (USD, Treasury Market)
Related tags:
Latest market news




The complete CFD trading experience
Award-winning platforms, competitive spreads, low commissions and dedicated support.
We live and breathe the markets and are dedicated to helping traders realise their ambitions as we continue to set the industry bar.
Economic calendar
Web Trader platform
Our sophisticated web-based platform is packed with features.
Related articles
Swiss Franc Forecast: USD/CHF Seven-Week Rally Reverses From Yearly Highs 10 16 2026
A sharp rejection from fresh highs has shifted momentum in favor of USD/CHF bears, raising the stakes for a critical support test.

Nasdaq 100 forecast: Tech stocks not out of woods yet
US index futures pushed higher in the first half of Friday’s session, taking cues from a strong performance from European equities. Both European and US equity futures extending yesterday’s impressive recovery after the sharp sell-off earlier in the week. But the lingering concerns around the AI investment cycle remain, while bond markets were easing lower again, lifting yields.


ASX 200 Outlook: A Rates Trade Disguised as a Stock Market?
Australian bond futures have exhibited a far stronger relationship with the ASX 200 than Wall Street over recent months. Now both markets are displaying remarkably similar price structures.

StoneX Europe Ltd may make third party material available on this website which may contain information included but not limited to the conditions of financial markets. The material is for information purposes only and does not contain, and should not be construed as containing, investment advice and/or investment recommendation and/or an investment research and/or an offer of or solicitation for any transactions in financial instruments; any decision to enter into a specific transaction shall be made by the client following an assessment by him/her of their situation.
StoneX Europe Ltd makes no representation or warranty and assumes no liability as to the accuracy or completeness of the information provided, nor any loss arising from any investment based on a recommendation, forecast or other information supplied. You should always seek independent advice as to your suitability to speculate in any related markets and your ability to assume the associated risks, if you are at all unsure. We are not under any obligation to update any such material. Any opinion made may be personal to the author and may not reflect the opinion of StoneX Europe Ltd.