



AUD/USD Hints at Pullback as US Dollar Bulls Regain Footing
AUD/USD slips from 15-month highs as US dollar momentum improves, while sticky CPI keeps the RBA cautious and limits downside follow-through.
Share this:

AUD/USD is showing early signs of fatigue after briefly pushing to fresh 15-month highs, with renewed US dollar strength and stretched technicals warning of a near-term pullback. While Australian inflation has cooled modestly, CPI remains above the Reserve Bank of Australia’s target band, keeping policy restrictive and limiting the scope for aggressive downside in the Aussie.
View related analysis:
View related analysis:
AUD/USD Outlook: Pullback Risks Rise as USD Finds Support
Australian Inflation Cools, but CPI Still Above RBA Target
Monthly inflation figures for November released on Wednesday showed that core CPI remains sticky, although price pressures have eased modestly. Trimmed mean CPI slowed to 3.2% y/y, while headline CPI fell to 3.4%, leaving both measures above the RBA’s 2–3% target band. Housing was again a key driver, contributing 1.1 percentage points to inflation and accounting for 21.4% of the total CPI basket.
While this eases pressure on the Reserve Bank of Australia to hike rates in Q1, it does nothing to justify rate cuts. Policymakers will want confirmation from the Q4 CPI figures due on 28 January before determining whether the February meeting is live—a possibility Governor Bullock effectively flagged in December. Until then, inflation remains uncomfortably high and the policy bias stays restrictive.
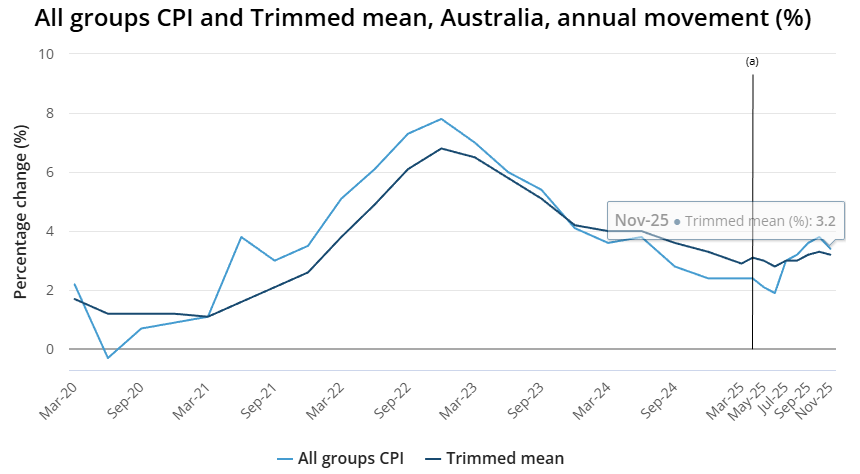
Chart prepared by Matt Simpson - data source: Australian Bureau of Statistics (ABS)


US Dollar Finds Its Footing
The US dollar index rose in the first week of the year to hint at an interim swing low around 97.50, although I doubt bulls will manage to drive prices back above 100. Prices have broken above last week’s bullish inside week and the prior week’s bearish engulfing candle, pointing to further near-term upside.
Regular readers will recall that I suspect a wave-C correction may have ended on the weekly chart, which keeps my broader bias tilted towards fading extended USD rallies. That, in turn, suggests AUD/USD bulls may look to buy dips rather than chase strength.
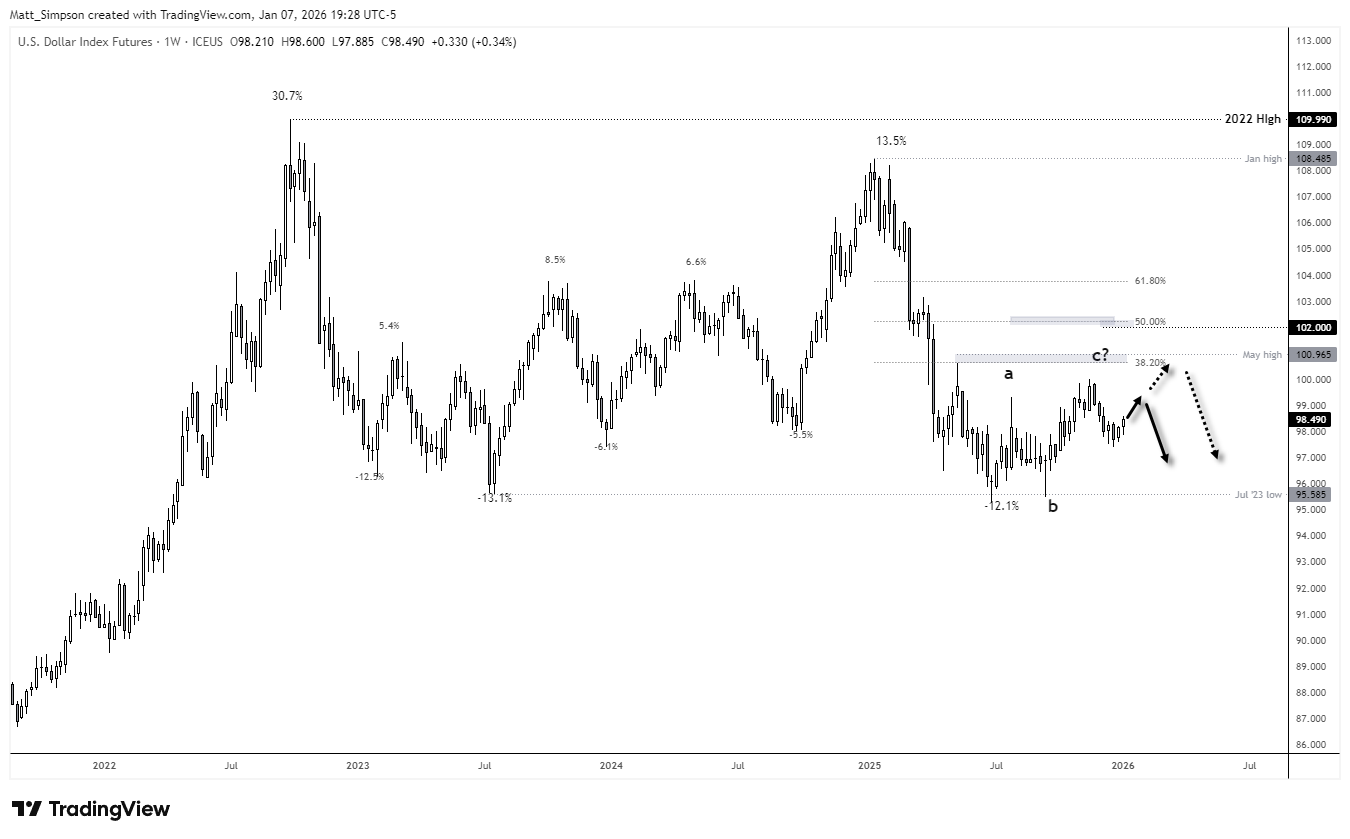
Chart analysis by Matt Simpson - Source: TradingView / ICE
AUD/USD Technical Analysis: Australian Dollar vs US Dollar
The daily chart shows the Australian dollar briefly hitting a 15-month high on Wednesday, before a stronger US dollar drove a full intraday reversal into the close. This has left a shooting star candlestick on the AUD/USD daily chart, reinforced by bearish RSI divergence, warning of at least a near-term pullback.
I’m not looking for anything aggressive at this stage, but a break below the September high at 0.6707, or the 67c handle, could see AUD/USD retrace towards its 20-day SMA near 0.6675.
A deeper pullback may require domestic data to undershoot expectations, particularly given current futures and options positioning. However, a decisive break below 0.6660 would open a run towards the 50-day SMA and prior swing highs and lows around 0.6592.
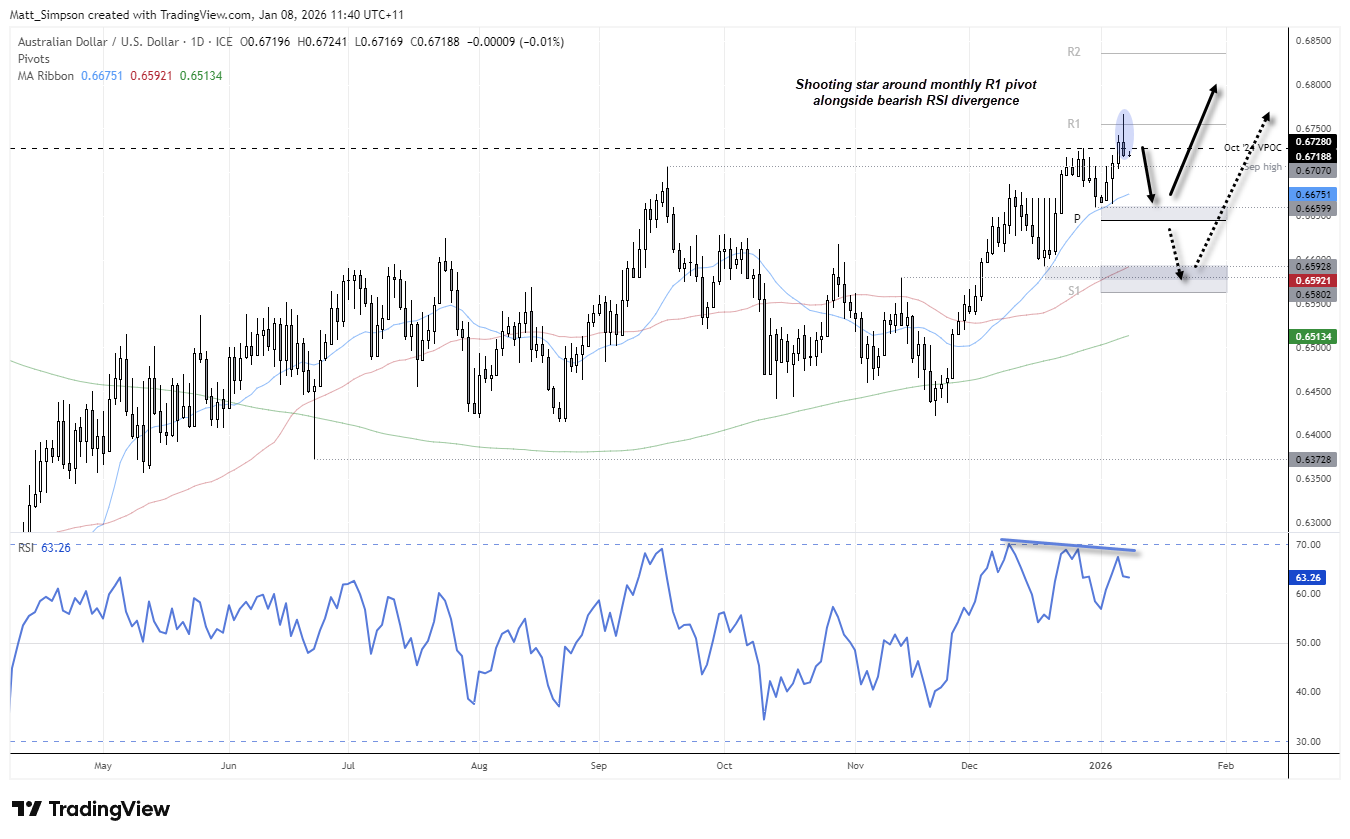
Chart analysis by Matt Simpson - Source: TradingView


AUD/USD Positioning: Australian Dollar Futures – COT Report
While futures traders remain net short AUD/USD, long exposure continues to trend higher among large speculators and asset managers. Short interest has only edged modestly higher among large specs and has largely flattened among asset managers.
With no immediate signs of sentiment reaching an extreme, futures traders could flip net long AUD/USD in the coming weeks or months, assuming no fresh bearish catalyst emerges for the Australian dollar.
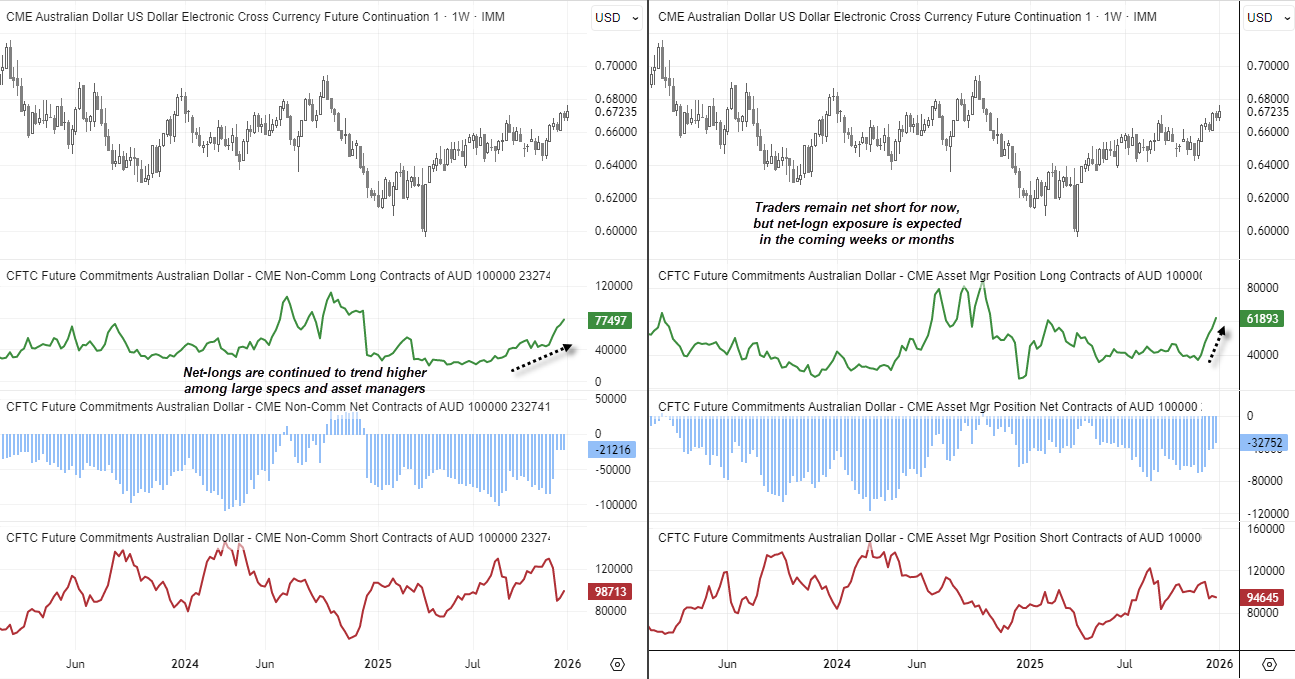
Chart analysis by Matt Simpson - Source: TradingView / ICE
View the full economic calendar
View the full economic calendar
-- Written by Matt Simpson
Follow Matt on Twitter @cLeverEdge
How to trade with City Index
You can trade with City Index by following these four easy steps:
- Open an account, or log in if you’re already a customer
• Open an account in the UK
• Open an account in Australia
• Open an account in Singapore
- Search for the market you want to trade in our award-winning platform
- Choose your position and size, and your stop and limit levels
- Place the trade
Related tags:
Latest market news




The complete CFD trading experience
Award-winning platforms, competitive spreads, low commissions and dedicated support.
We live and breathe the markets and are dedicated to helping traders realise their ambitions as we continue to set the industry bar.
Economic calendar
Web Trader platform
Our sophisticated web-based platform is packed with features.
Related articles
Swiss Franc Forecast: USD/CHF Seven-Week Rally Reverses From Yearly Highs 10 16 2026
A sharp rejection from fresh highs has shifted momentum in favor of USD/CHF bears, raising the stakes for a critical support test.

AUD/USD Bulls Fight Back After Australian Jobs Shock
AUD/USD has been hit by another ugly Australian employment report, sending RBA rate hike expectations sharply lower. Yet the relationships driving the currency have shifted since quarter-end, and improving risk appetite could provide the fuel for a recovery.


USD/JPY Update: Can the Japanese Yen Sustain Its Recovery?
Short-term price action around the Japanese yen has started to show some relative improvement over recent sessions. This can be seen in the recent performance of USD/JPY, which has now recorded three consecutive daily declines in favor of the Japanese currency, resulting in a depreciation of roughly 0.35% over the period.

StoneX Europe Ltd may make third party material available on this website which may contain information included but not limited to the conditions of financial markets. The material is for information purposes only and does not contain, and should not be construed as containing, investment advice and/or investment recommendation and/or an investment research and/or an offer of or solicitation for any transactions in financial instruments; any decision to enter into a specific transaction shall be made by the client following an assessment by him/her of their situation.
StoneX Europe Ltd makes no representation or warranty and assumes no liability as to the accuracy or completeness of the information provided, nor any loss arising from any investment based on a recommendation, forecast or other information supplied. You should always seek independent advice as to your suitability to speculate in any related markets and your ability to assume the associated risks, if you are at all unsure. We are not under any obligation to update any such material. Any opinion made may be personal to the author and may not reflect the opinion of StoneX Europe Ltd.