




AUD weaker on soft GDP report, CPI up next
Share this:

Australian GDP in Q3 2022
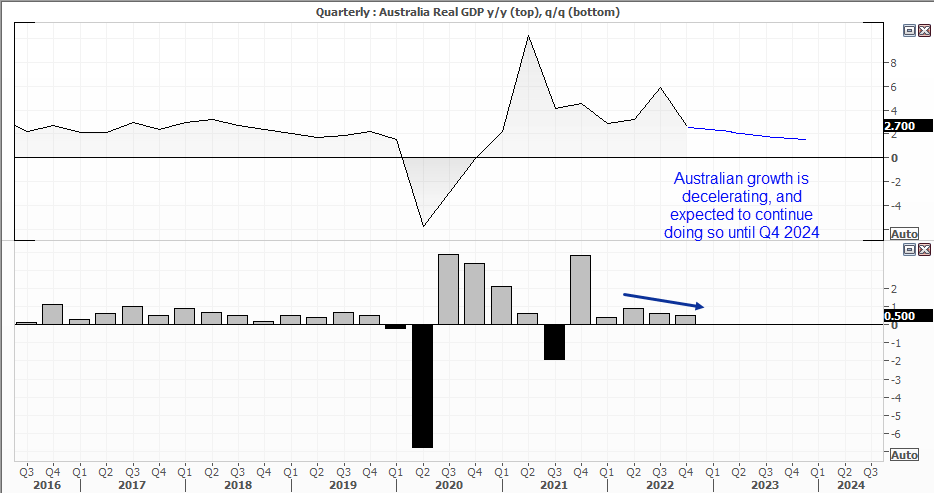
- GDP rose 2.7% y/y (2.7% expected, 5.9% prior)
- Australian GDP rose 0.5% q/q (0.8% expected, 0.6% prior)
- Australian CPI rose %y/y (8.1% expected, 8.4% prior)
- Exports outstripped imports for a third quarter and was a main contributor to GDP
- Household consumption fell to 0.3% q/q, its lowest level since Q3 21
- Household savings fell to a 4-year low of 4.5%
Australian GDP grew at the annual rate of 2.7% in Q4, in line with economists consensus and the RBA’s recent forecast. Yet it grew just 0.5% q/q compared with 0.8% forecast, down from 0.6% - and that shows momentum for the economy is slowing.
Australian growth is expected to trend lower for the next three quarters, before slowly turning higher from the December quarter, as per the RBA’s forecasts from their February meeting. But perhaps one of the more interesting metrics (and one the RBA are watching closely) is the households savings ratio. At 4.5%, it is the lowest since Q3 2017 and has moved lower for five consecutive quarters (or nine of the past ten). And that basically means that households are blowing through their buffers, which itself is inflationary.
Australian retail trade is down but not out
On the other hand, retail trade posted a 1.9% gain in January, which shows consumers are still spending. It partially alleviates concerns that consumers were feeling the pinch of high rates following December’s -3.9% print. For now, it appears that weak December data is a seasonal tendency now shopper’s stockpile over the November Black Friday and Cyber Monday sales. With that said, 1.9% is hardly setting the world alight and does not make up for December’s miss, but it also shows that consumers are not ready to keel over and stop spending just yet. But spending is slowing overall.
AUD/NZD daily chart:
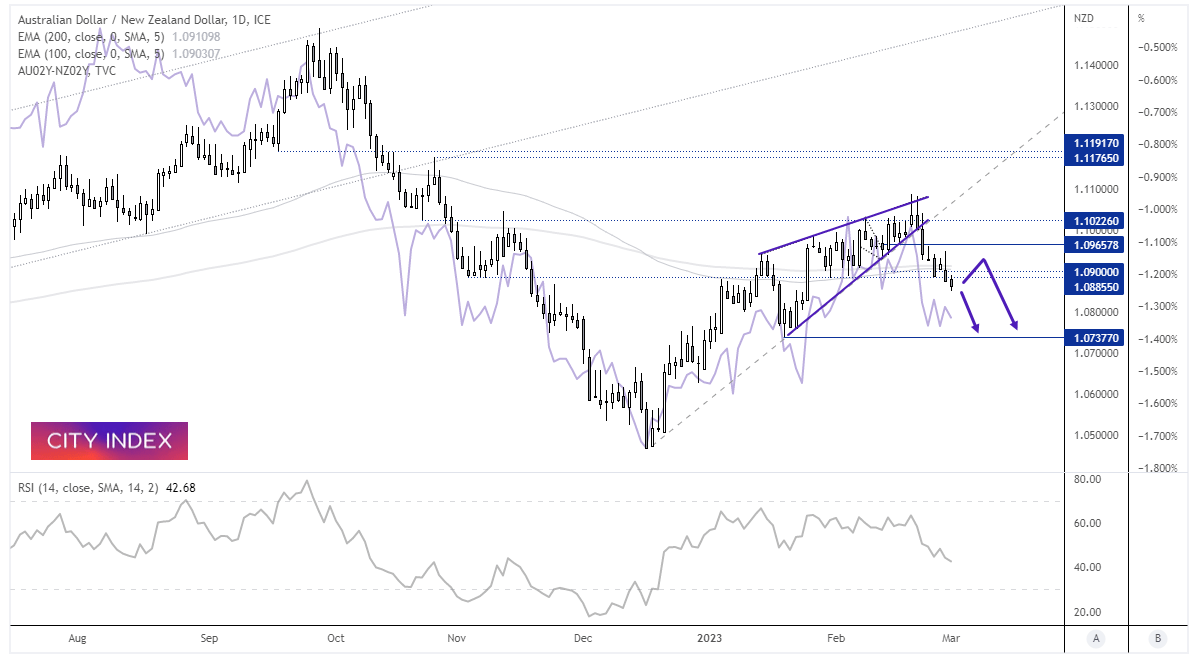

Today’s soft growth report has weighed on Australian yields, pushing the AU-NZ 2-year differential lower and dragging AUD/NZD along with it. The relationship with yields has been pretty strong of late (unlike the AUD/USD equivalent spread).
The daily chart shows AUD/NZD has broken trend support and closed beneath the 100 and 200-day EMA’s. The bearish wedge formation suggests a target near the 1.0737 low, so from here bears could seek to sell minor rallies below 1.1000 or wait for a break of today’s low to assume bearish continuation. Please note, the monthly CPI report was due to drop at 11:30 AEST but (so far) there are no signs of it.
Should it rise 8% or lower it is likely to weigh further on AUD pairs, amidst excited calls for ‘peak inflation’ – assuming last month’s 8.4% was indeed the peak. Conversely, a strong inflation print (particularly if above 8.4%) could quickly ruin the bearish bias for AUD/NZD.
-- Written by Matt Simpson
Follow Matt on Twitter @cLeverEdge
How to trade with City Index
You can trade with City Index by following these four easy steps:
- Open an account, or log in if you’re already a customer
• Open an account in the UK
• Open an account in Australia
• Open an account in Singapore
- Search for the market you want to trade in our award-winning platform
- Choose your position and size, and your stop and limit levels
- Place the trade
Related tags:
Latest market news



The complete CFD trading experience
Award-winning platforms, competitive spreads, low commissions and dedicated support.
We live and breathe the markets and are dedicated to helping traders realise their ambitions as we continue to set the industry bar.
Economic calendar
Web Trader platform
Our sophisticated web-based platform is packed with features.
Related articles
Gold Q4 2026 outlook: Resilience in the face of rallying dollar and yields
As we headed towards the latter stages of Q3 and into Q4, the Fed had just hiked rates in a hawkish FOMC meeting, while the likes of the ECB and BoJ had also tightened their respective policies. Oil prices remained elevated amid the prolonged US-Iran conflict. Meanwhile, bond yields were breaking out, and the dollar was higher across the board. Yet, remarkably, gold was still holding in the positive territory for the third quarter, even if it had weakened somewhat in September.

EUR/USD Q4 2026 Outlook: Euro at a Crossroads as Fed, ECB Tighten 9 25 2026
EUR/USD enters Q4 at a pivotal inflection point as competing Fed-ECB policy paths and persistent inflation risks collide with major technical support.


USD/JPY Q4 2026 Outlook: Hawkish Fed Pricing Clashes With Intervention Risk
The year-end tug-of-war is clear: hawkish Fed pricing supports USD/JPY, while intervention risk limits the upside.

StoneX Europe Ltd may make third party material available on this website which may contain information included but not limited to the conditions of financial markets. The material is for information purposes only and does not contain, and should not be construed as containing, investment advice and/or investment recommendation and/or an investment research and/or an offer of or solicitation for any transactions in financial instruments; any decision to enter into a specific transaction shall be made by the client following an assessment by him/her of their situation.
StoneX Europe Ltd makes no representation or warranty and assumes no liability as to the accuracy or completeness of the information provided, nor any loss arising from any investment based on a recommendation, forecast or other information supplied. You should always seek independent advice as to your suitability to speculate in any related markets and your ability to assume the associated risks, if you are at all unsure. We are not under any obligation to update any such material. Any opinion made may be personal to the author and may not reflect the opinion of StoneX Europe Ltd.