








AUD/USD, NZD/USD: Commodity FX lead the way amid mild risk-on bounce
Given that commodity currencies such as AUD/NZD and NZD/USD have succumbed to USD strength for the best part of four months, the idea of a correction may not be overdue. Add into the mix bullish divergences on net-short exposure and false break of key lows, perhaps one is already underway.
Share this:

Appetite for risk was given a bump on Tuesday following Trump and Trudeau’s last-minute deal to defer Canada’s 25% tariffs for 30 days. It stopped short of a full risk-on recovery though, perhaps because the threat of tariffs still linger and that China gave a lukewarm retaliation to their less-severe 10% tariffs. Still, you have to take what you can get sometimes.
In what seemed to be more of a formality, China imposed tariffs on a small selection of US products, prompting Trump to say “that’s fine”. Riveting stuff. Still, they are now taking the almost obligatory step of investigating Google, who are now suspected of breaking anti-monopoly laws. Let the tit-for-tat investigations begin.


The USD was the weakest FX major, sending the US dollar index lower for a second day and down -1.9% from Monday’s tariff-panic high. A relieved Canadian dollar led commodity FX pairs AUD/USD and NZD/USD higher. CAD is up 3.3% from Monday’s low, AUD/USD has risen 3% and NZD/USD 2.6% over the same period.
While volatility was lower compared to Monday, it remained elevated across the board with all major FX pairs and commodities exceeding their 10-day ATRs (average true ranges). Headline risks surrounding tariffs will of course remain in place, but for now at least, the volatile knee-jerk reactions of Monday are in the rear-view mirror. And that should allow traders to refocus on economic data such as the incoming ISM services and nonfarm payroll reports.
Commodity FX futures (AUD, CAD, NZD) positioning – COT report
If you stop to consider that commodity FX have been falling against the USD four the best part of four months, then it becomes reasonable to assume a snapback to the mean could be due in the coming weeks. So it is interesting to note the following:
- A multi-month bullish divergence between net-short exposure and CAD futures has been forming
- We may have just witnessed a false break of CAD/USD’s 2020 low
- NZD/USD is also trying to recover from its near break of its 2022 low while net-short exposure drifts lower from its record highs (a potential sentiment extreme)
- Asset managers have been reducing their net-short exposure to AUD/USD futures for several weeks, forming another bullish divergence
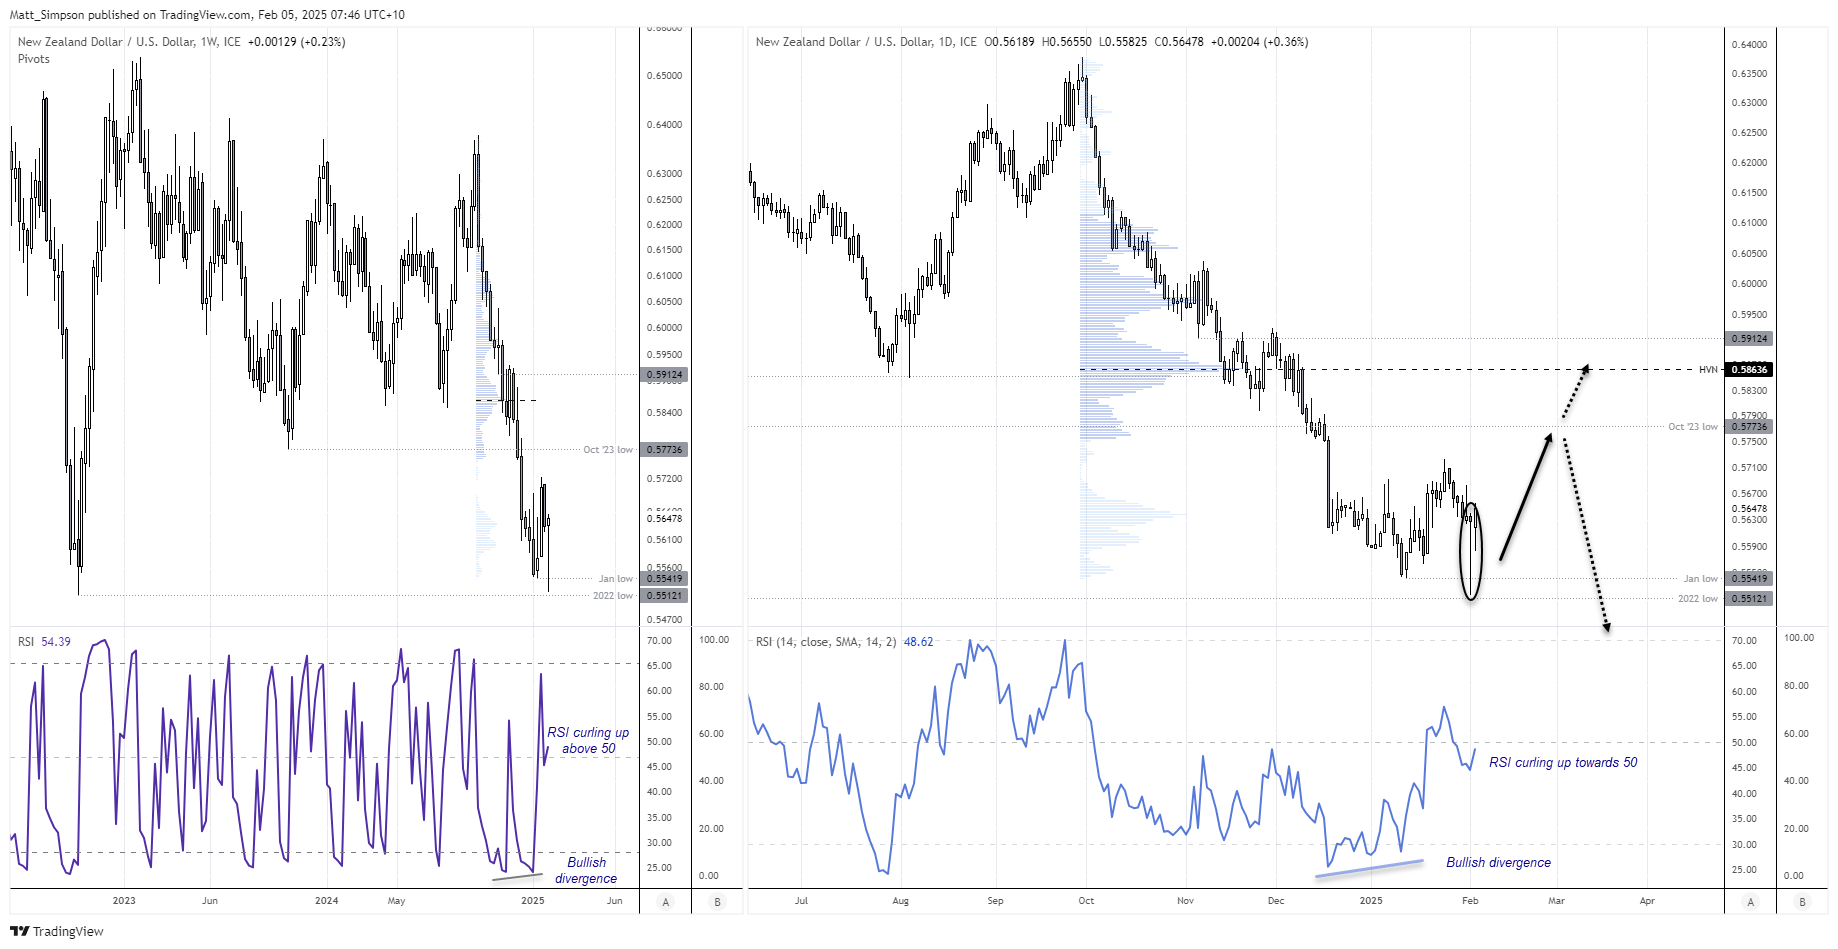
NZD/USD technical analysis:
Monday’s selloff and prompt reversal mean NZD/USD managed to avoid retesting its 2022 low by a few pips. A bullish divergence has formed on the weekly RSI (2) to show the potential for some near-term mean reversion, and if it were to close the week around current prices we’d have a bullish hammer candle to contend with.
A bullish divergence also formed on the daily RSI (14) ahead of January’s low, and Monday’s elongated bullish pinbar marks a false break of it. I suspect we’ve seen an important swing low, and retracements within Monday’s range could be seen as favourably by bulls.
Perhaps a move to the October 2023 low (0.5777) or the high-volume node (HVN) at 0.5863b could be on the cards, while prices hold above the 2022 low.
AUD/USD technical analysis:
Unlike the Kiwi dollar, AUD/USD both broke beneath its 2022 low last month and its January low on Monday. Yet like the Kiwi, it now trades above these two milestone levels. So without feeling the need to provide similar analysis on the weekly chart, we’ll look at the daily and 1-hour chart.
AUD/USD rose for a second day, and is not close to its 2023 low. Perhaps bulls will shoot for it this session, but it is a level which seems likely to act as resistance. Also note that the 1-hour RSI (14) has reached overbought, and the 50-day SMA and EMAs reside around the 63c mark.
Upside potential could be limited over the near-term unless appetite for risk makes a full recover. But with NFP looming, volatility will likely be lower, which leaves AUD/USD vulnerable to a retracement lower. The monthly pivot (0.6222) and the HVN (0.6205) could make a support level for bears to target or bulls wait to see if they provide a swing low.
View the full economic calendar
View the full economic calendar
-- Written by Matt Simpson
Follow Matt on Twitter @cLeverEdge
How to trade with City Index
You can trade with City Index by following these four easy steps:
- Open an account, or log in if you’re already a customer
• Open an account in the UK
• Open an account in Australia
• Open an account in Singapore
- Search for the market you want to trade in our award-winning platform
- Choose your position and size, and your stop and limit levels
- Place the trade
Related tags:
Latest market news




The complete CFD trading experience
Award-winning platforms, competitive spreads, low commissions and dedicated support.
We live and breathe the markets and are dedicated to helping traders realise their ambitions as we continue to set the industry bar.
Economic calendar
Web Trader platform
Our sophisticated web-based platform is packed with features.
Related articles
EUR/USD weekly outlook: FOMC and ECB to set the tone
The current backdrop is modestly bearish. On Friday, the EUR/USD closed modestly lower, down for the third consecutive day. The pair also posted a weekly decline after staging a modest recovery attempt in the previous week. Out of the past 8 weeks, the EUR/USD has fallen on 6 occasions. There is not much supporting factors for the single currency right now. So, the upside remains capped.


Silver forecast: metals liquidation drags XAG/USD into $50-55 support
Silver has broken its July low and slipped into a long-term support zone as the selling in precious metals deepens. The chart shows where the metal could bottom, and next week's Fed decision may decide whether it does.

Australian Dollar Forecast: AUD/USD Support Reversal Sparks Monthly Range Breakout 10 23 2026
A sharp reversal off key support has fueled the AUD/USD recovery, with resistance now in focus ahead of next week’s Fed decision and Australian CPI.

StoneX Europe Ltd may make third party material available on this website which may contain information included but not limited to the conditions of financial markets. The material is for information purposes only and does not contain, and should not be construed as containing, investment advice and/or investment recommendation and/or an investment research and/or an offer of or solicitation for any transactions in financial instruments; any decision to enter into a specific transaction shall be made by the client following an assessment by him/her of their situation.
StoneX Europe Ltd makes no representation or warranty and assumes no liability as to the accuracy or completeness of the information provided, nor any loss arising from any investment based on a recommendation, forecast or other information supplied. You should always seek independent advice as to your suitability to speculate in any related markets and your ability to assume the associated risks, if you are at all unsure. We are not under any obligation to update any such material. Any opinion made may be personal to the author and may not reflect the opinion of StoneX Europe Ltd.