





AUD/USD Recovery Pulls RSI Away from Oversold Territory
The recent recovery in AUD/USD kept the RSI above 30, and the oscillator may continue to show the bearish momentum abating as it moves away from oversold territory.
Share this:

Australian Dollar Outlook: AUD/USD
AUD/USD trades to a fresh weekly high (0.6638) after showing a limited reaction to the Reserve Bank of Australia (RBA) interest rate decision, and the exchange rate may appreciate over the remainder of the week as the Federal Reserve is expected to deliver a 25bp rate-cut.
AUD/USD Recovery Pulls RSI Away from Oversold Territory
Keep in mind, the recent recovery in AUD/USD kept the Relative Strength Index (RSI) above 30, and the oscillator may continue to show the bearish momentum abating as it moves away from oversold territory.
Join David Song for the Weekly Fundamental Market Outlook webinar. David provides a market overview and takes questions in real-time. Register Here
As a result, AUD/USD may extend the recent series of higher highs and lows going into the Federal Open Market Committee (FOMC) meeting, and the looming decision by Chairman Jerome Powell and Co. may sway the exchange rate as the central bank pursues a neutral stance.
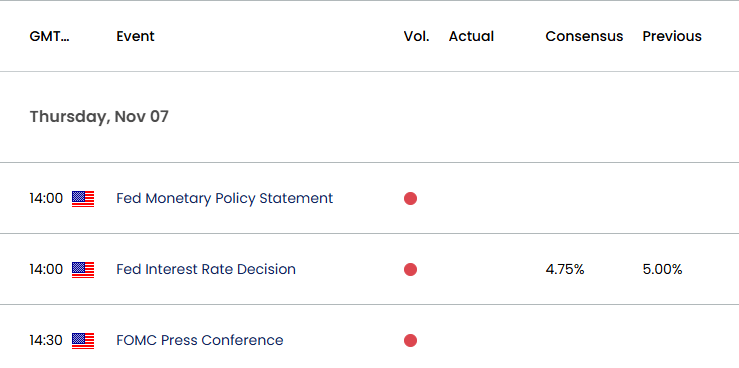
US Economic Calendar
The FOMC may continue to strike a dovish forward guidance even after reducing the benchmark interest rate to a fresh threshold of 4.50% to 4.75% as the central bank ‘projects that the appropriate level of the federal funds rate will be 4.4 percent at the end of this year.’
With that said, indications of a further Fed rate cuts may keep AUD/USD afloat especially as the RBA remains reluctant to switch gears, but the exchange rate may threaten the bullish price series should the central bank show a greater willingness to keep US interest rates on hold at its last meeting for 2024.
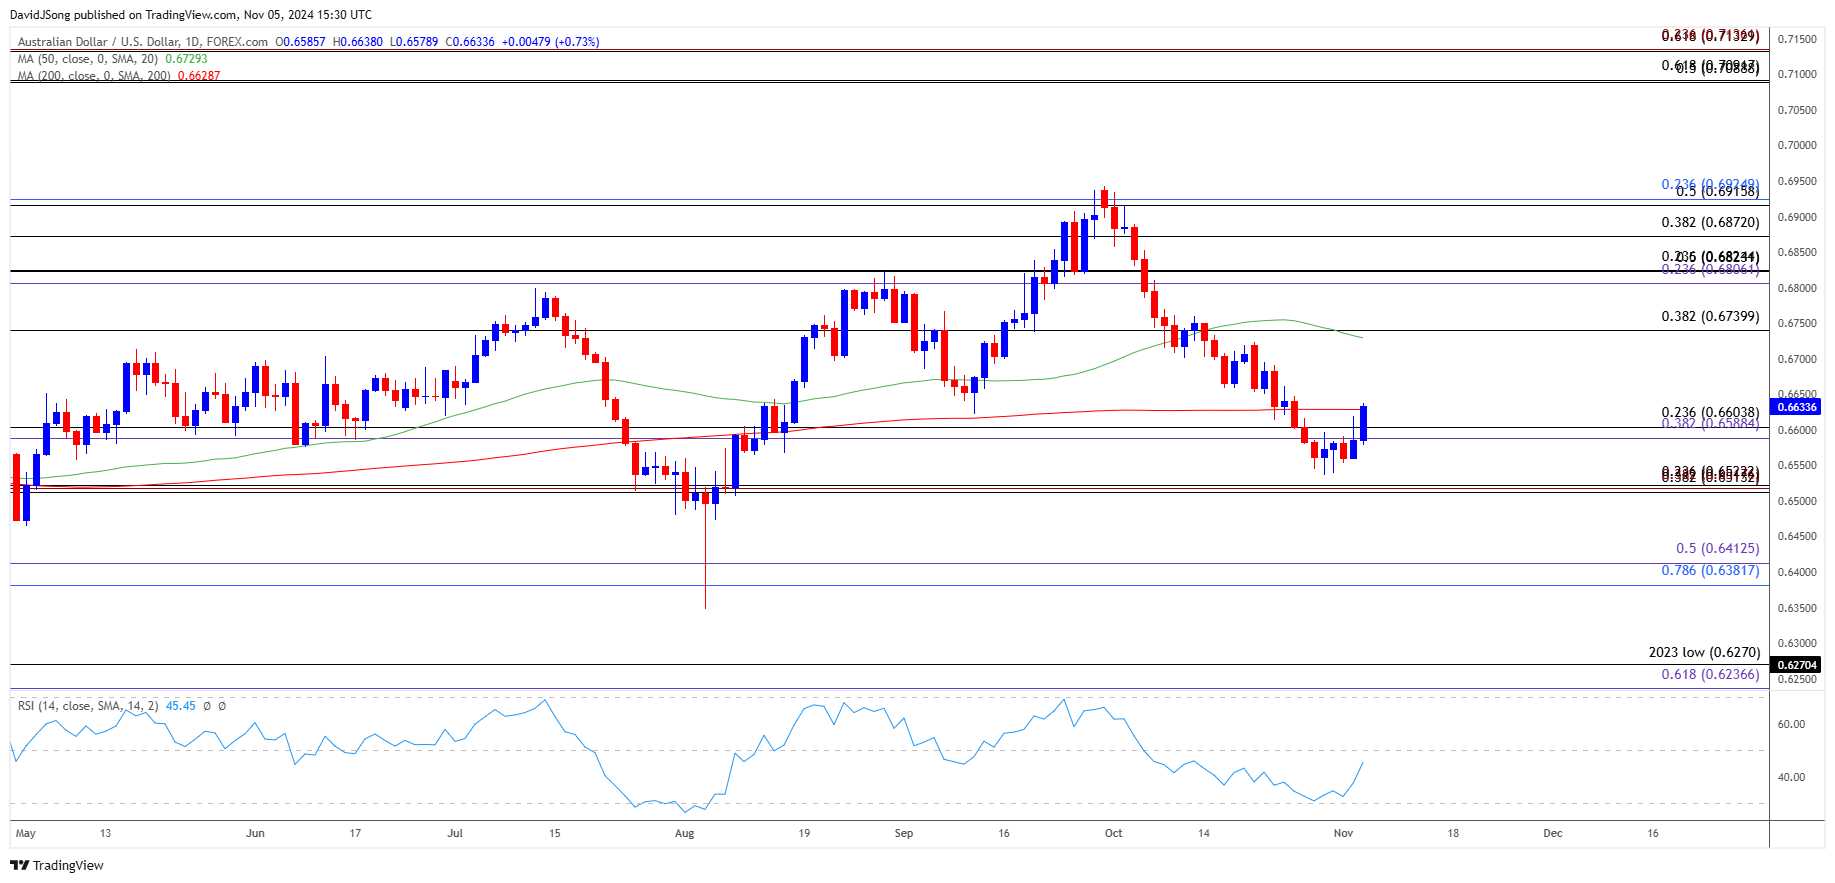
AUD/USD Price Chart – Daily
Chart Prepared by David Song, Strategist; AUD/USD on TradingView
- The opening range for November is in focus for AUD/USD as it trades back above the 0.6590 (38.2% Fibonacci extension) to 0.6600 (23.6% Fibonacci retracement) zone, with a break/close above 0.6740 (38.2% Fibonacci retracement) opening up the 0.6810 (23.6% Fibonacci extension) to 0.6820 (23.6% Fibonacci retracement) region.
- Next area of interest comes in around 0.6870 (38.2% Fibonacci retracement) but AUD/USD may snap the recent series of higher highs and lows if it struggles to hold above the 0.6590 (38.2% Fibonacci extension) to 0.6600 (23.6% Fibonacci retracement) zone.
- Failure to hold above the October low (0.6537) brings the 0.6510 (38.2% Fibonacci retracement) to 0.6520 (23.6% Fibonacci retracement) region back on the radar, with the next area of interest coming in around 0.6380 (78.6% Fibonacci retracement) to 0.6410 (50% Fibonacci extension).
Additional Market Outlooks
Monetary vs Fiscal Policy: Implications for FX Markets
USD/CAD Reverses Ahead of 2022 High with Fed Rate Decision on Tap
Euro Forecast: EUR/USD Recovery Persists Ahead of Euro Area CPI Report
British Pound Outlook: GBP/USD Recovery Emerges Ahead of UK Budget
--- Written by David Song, Senior Strategist
Follow on X at @DavidJSong
Related tags:
Latest market news




The complete CFD trading experience
Award-winning platforms, competitive spreads, low commissions and dedicated support.
We live and breathe the markets and are dedicated to helping traders realise their ambitions as we continue to set the industry bar.
Economic calendar
Web Trader platform
Our sophisticated web-based platform is packed with features.
Related articles
EUR/USD weekly outlook: FOMC and ECB to set the tone
The current backdrop is modestly bearish. On Friday, the EUR/USD closed modestly lower, down for the third consecutive day. The pair also posted a weekly decline after staging a modest recovery attempt in the previous week. Out of the past 8 weeks, the EUR/USD has fallen on 6 occasions. There is not much supporting factors for the single currency right now. So, the upside remains capped.


Silver forecast: metals liquidation drags XAG/USD into $50-55 support
Silver has broken its July low and slipped into a long-term support zone as the selling in precious metals deepens. The chart shows where the metal could bottom, and next week's Fed decision may decide whether it does.

Australian Dollar Forecast: AUD/USD Support Reversal Sparks Monthly Range Breakout 10 23 2026
A sharp reversal off key support has fueled the AUD/USD recovery, with resistance now in focus ahead of next week’s Fed decision and Australian CPI.

StoneX Europe Ltd may make third party material available on this website which may contain information included but not limited to the conditions of financial markets. The material is for information purposes only and does not contain, and should not be construed as containing, investment advice and/or investment recommendation and/or an investment research and/or an offer of or solicitation for any transactions in financial instruments; any decision to enter into a specific transaction shall be made by the client following an assessment by him/her of their situation.
StoneX Europe Ltd makes no representation or warranty and assumes no liability as to the accuracy or completeness of the information provided, nor any loss arising from any investment based on a recommendation, forecast or other information supplied. You should always seek independent advice as to your suitability to speculate in any related markets and your ability to assume the associated risks, if you are at all unsure. We are not under any obligation to update any such material. Any opinion made may be personal to the author and may not reflect the opinion of StoneX Europe Ltd.