


Bitcoin's Bigger Problem Isn't AI
Bitcoin, semis and even gold are getting hammered. Our research suggests an overlooked macro force may help explain why, with Bitcoin now approaching a major support zone.
Share this:
- US financial conditions tightening at rapid pace
- Bitcoin declined during all six comparable tightening episodes
- Gold's slide defies its historical safe-haven performance
- Bitcoin approaches major support zone
Bitcoin has often moved in tandem with US tech stocks, making it tempting to attribute the cryptocurrency's latest rout to the same concerns hammering the AI complex. Will the enormous capital expenditure deliver adequate returns? Could Jensen Huang's resignation spell the end of the circular financing arrangements that have helped fuel the boom?
But is that the whole story? What we're witnessing is quickly becoming a substantial tightening in US financial conditions. Beneath all the headlines, it's a development that may not only explain why Bitcoin is under the pump, but why other high-beta risk assets are also getting hammered.
Tracking US financial conditions in real time
Source: TradingView, LSEG
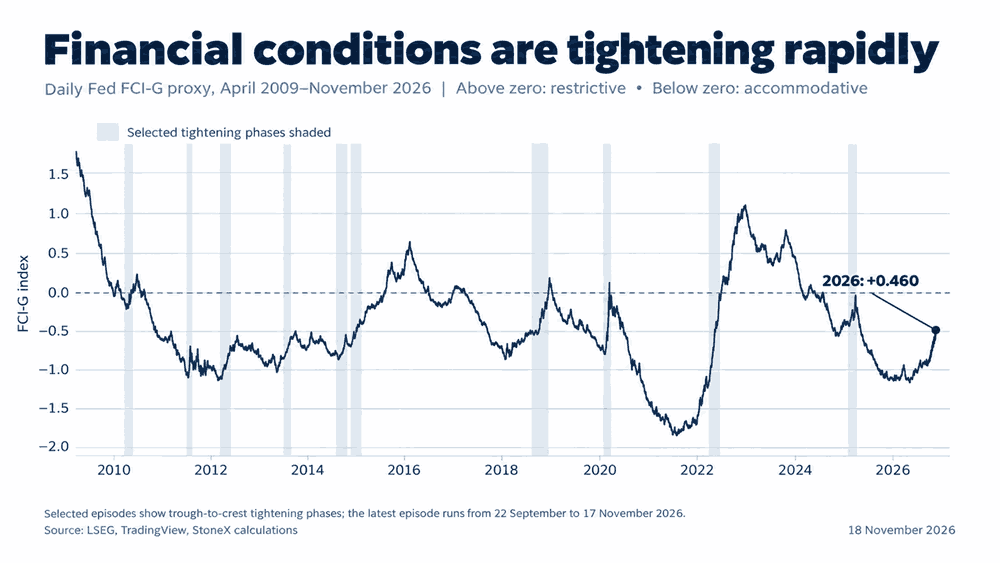
How do we know this is happening? We've reconstructed the Federal Reserve's Financial Conditions Impulse on Growth (FCI-G) as a daily indicator. Rather than waiting for the Fed's monthly release, our model provides a near real-time assessment of how broader US financial conditions are evolving.
Source: Federal Reserve
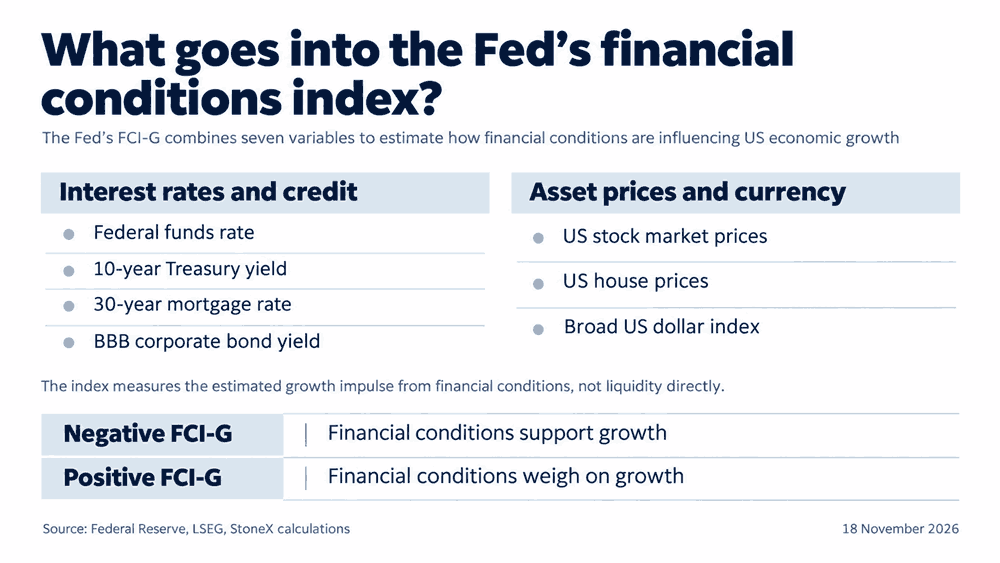
The index combines seven variables covering interest rates, borrowing costs, equity and house prices, and the US dollar. Negative readings indicate financial conditions are supporting economic growth, while positive readings suggest they're weighing on it. Importantly, particularly given what we're witnessing right now, rapid tightening can also be a symptom of liquidity being withdrawn from the financial system.
Financial accommodation unwinds rapidly
Source: TradingView, LSEG
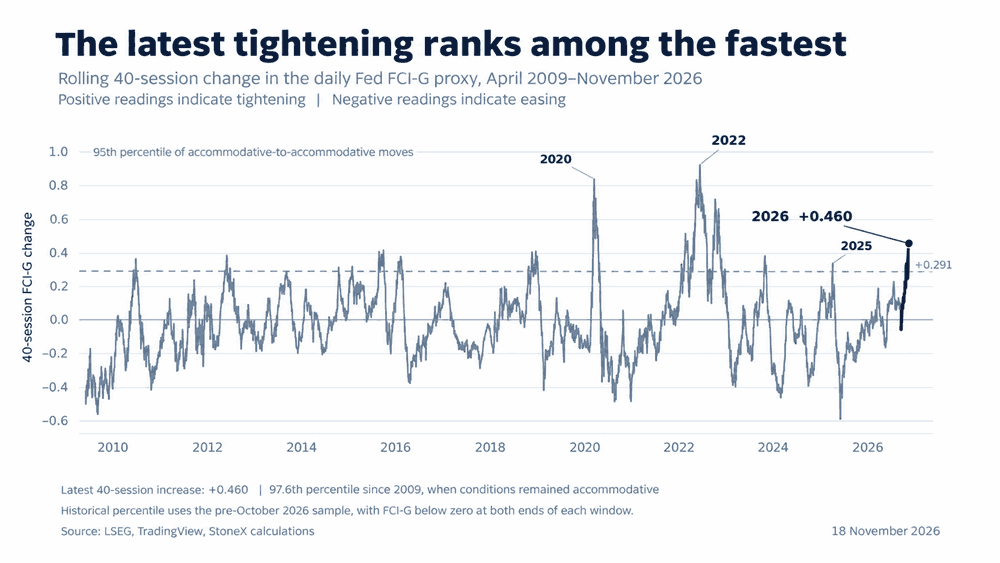
While our financial conditions proxy remains in accommodative territory, the speed at which that accommodation is being withdrawn is what stands out. Since 22 September, the index has risen by 0.460 points, with the increase ranking around the 98th percentile of comparable 40-session moves since 2009.
Similar episodes of rapid tightening have often coincided with heightened volatility across risk assets, notably at the onset of the COVID-19 pandemic in March 2020 and following the Liberation Day tariff announcement in April 2025. That suggests the current weakness in Bitcoin and other high-beta plays may be driven by something other than concerns surrounding AI.
Bitcoin's grim historical record
Source: TradingView, LSEG
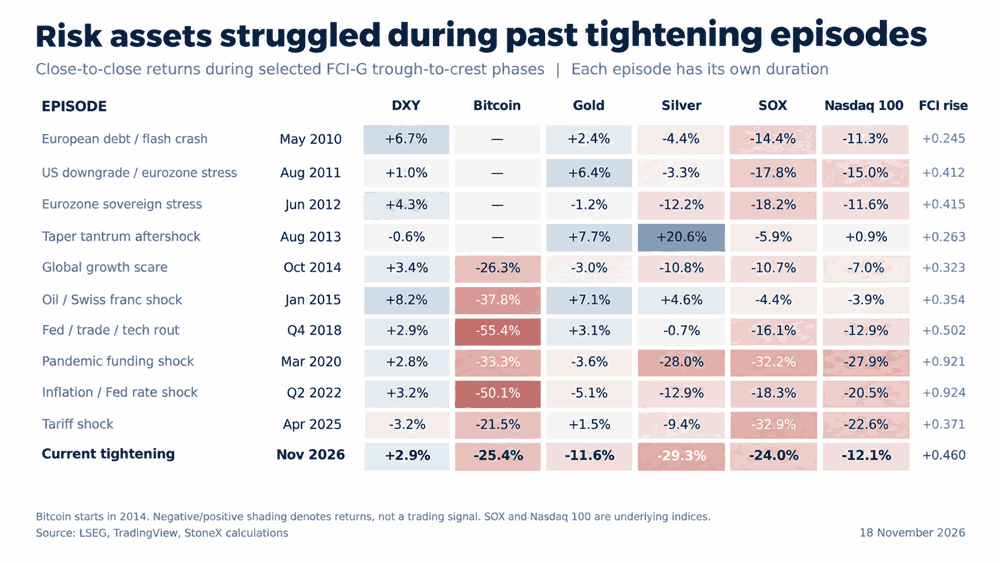
Looking back at previous episodes of rapid tightening, Bitcoin's record makes for grim reading. It declined in all six episodes for which we have data, including falls of 55.4% in late 2018 and 50.1% during the Fed's aggressive tightening cycle in 2022. The weakness wasn't confined to crypto, with semis declining in all 10 historical episodes and the Nasdaq 100 falling in nine, often accompanied by rising realised volatility.
Historically, the US dollar and gold have fared considerably better. DXY rose in eight of the 10 episodes, while gold advanced in six. But gold's recent performance tells a very different story. The precious metal has fallen 11.6% during the current tightening episode, its worst performance across our historical sample, reinforcing the view that gold is now trading more like a liquidity-sensitive risk asset than a traditional safe haven.
Bitcoin bears face a major support test
Source: TradingView
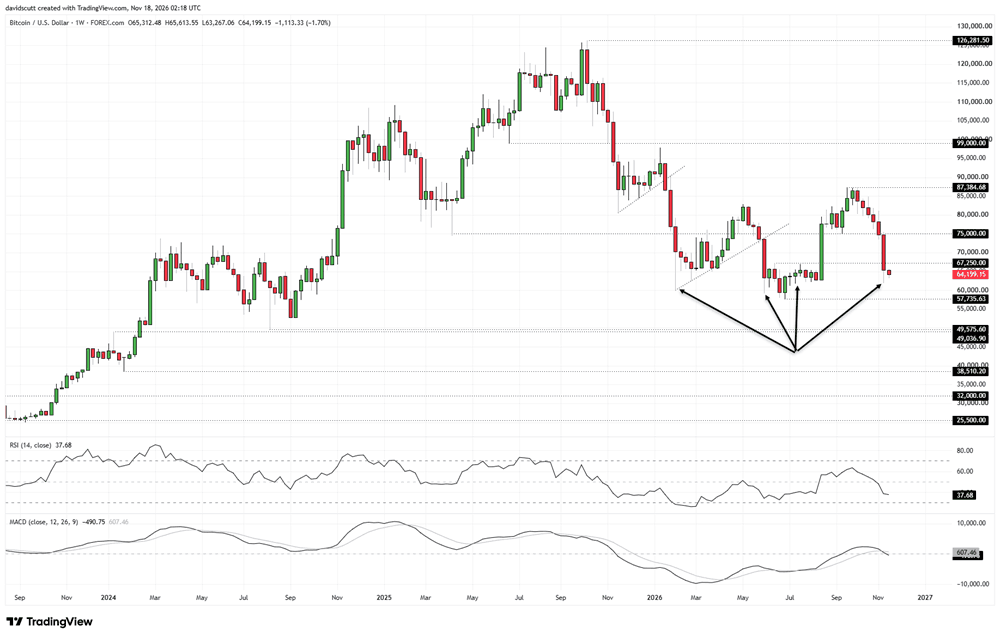
The rapid tightening in financial conditions goes a long way towards explaining Bitcoin's increasingly bearish weekly chart. The price has fallen for six consecutive weeks and is currently on track to notch up number seven, taking it back to levels last seen around the middle of the year. RSI (14) has slipped beneath the neutral 50 level, while MACD has staged a bearish crossover and moved into negative territory. The technical picture continues to favour bearish setups over bullish ones on longer timeframes.
However, while the price action and oscillators favour the bears, where Bitcoin now sits provides some offset. Since early July, buyers have repeatedly emerged on dips beneath $63,000, including last week's move towards $62,000. Looking further back, bids also appeared beneath $60,000 in February and June, with the latter producing a low of $57,735. As such, Bitcoin now sits above what has been a pretty substantial support zone in the past.
The question, given the tightening in financial conditions, is whether that demand will hold. A sustained break beneath $57,735 would create something of a vacuum for technical support, with nothing really on the radar until the August 2024 swing low of $49,575 and former resistance at $49,036.
If Bitcoin were to recover some ground, $67,250 is the first level to watch, having marked the June high and an area the price struggled to retest in late July. A recovery of that level would bring $75,000 into focus, a level that has repeatedly acted as both support and resistance throughout 2025 and 2026.



The complete CFD trading experience
Award-winning platforms, competitive spreads, low commissions and dedicated support.
We live and breathe the markets and are dedicated to helping traders realise their ambitions as we continue to set the industry bar.
Economic calendar
Web Trader platform
Our sophisticated web-based platform is packed with features.
Related articles
Bitcoin's Bigger Problem Isn't AI
Bitcoin, semis and even gold are getting hammered. Our research suggests an overlooked macro force may help explain why, with Bitcoin now approaching a major support zone.

US dollar rally loses yield support as Nvidia looms
US yields are retreating, but the dollar isn't following. With risk aversion potentially keeping it supported, Nvidia's results could determine whether emerging reversal signals in AUD/USD and EUR/USD develop further.

Gold Price Short-term Outlook: XAU/USD Bears Face Critical Test at Yearly Lows 11 17 2026
Gold's decline is showing signs of exhaustion at major support, with a pivotal range break in focus ahead of the FOMC minutes.

StoneX Europe Ltd may make third party material available on this website which may contain information included but not limited to the conditions of financial markets. The material is for information purposes only and does not contain, and should not be construed as containing, investment advice and/or investment recommendation and/or an investment research and/or an offer of or solicitation for any transactions in financial instruments; any decision to enter into a specific transaction shall be made by the client following an assessment by him/her of their situation.
StoneX Europe Ltd makes no representation or warranty and assumes no liability as to the accuracy or completeness of the information provided, nor any loss arising from any investment based on a recommendation, forecast or other information supplied. You should always seek independent advice as to your suitability to speculate in any related markets and your ability to assume the associated risks, if you are at all unsure. We are not under any obligation to update any such material. Any opinion made may be personal to the author and may not reflect the opinion of StoneX Europe Ltd.