



Bitcoin Analysis: BTC rebounds above 64k as dollar weakens
As the trading week progresses, one of the most relevant events in the cryptocurrency market has been the recent recovery in Bitcoin. The price has started to show strength again amid the short-term loss of momentum in the U.S. dollar.
Share this:

As the trading week progresses, one of the most relevant events in the cryptocurrency market has been the recent recovery in Bitcoin. The price has started to show strength again amid the short-term loss of momentum in the U.S. dollar.
Activity around BTC appears to have recovered and, for now, the asset is maintaining some buying pressure. If weakness in relevant substitute markets continues, this new bullish pressure could become more important over the next few sessions.


Demand returns to the market
The trading session has been relevant for financial markets in general, following the release of CPI inflation data in the United States. The market expected an average annual rate of 3.8%, but the official figure surprised to the downside and came in at 3.5%.
This slowdown in price pressures has created expectations of a less aggressive Federal Reserve. As a result, the 10-year U.S. Treasury yield has started to show weaker bullish momentum, falling below the 4.6% area. This loss of appeal in the bond market may have also affected one of Bitcoin’s most relevant substitute markets: the U.S. dollar.
This chain of events is important for Bitcoin price movements, as the dollar’s recent weakness may have opened room for a more consistent recovery in the cryptocurrency over the short term.
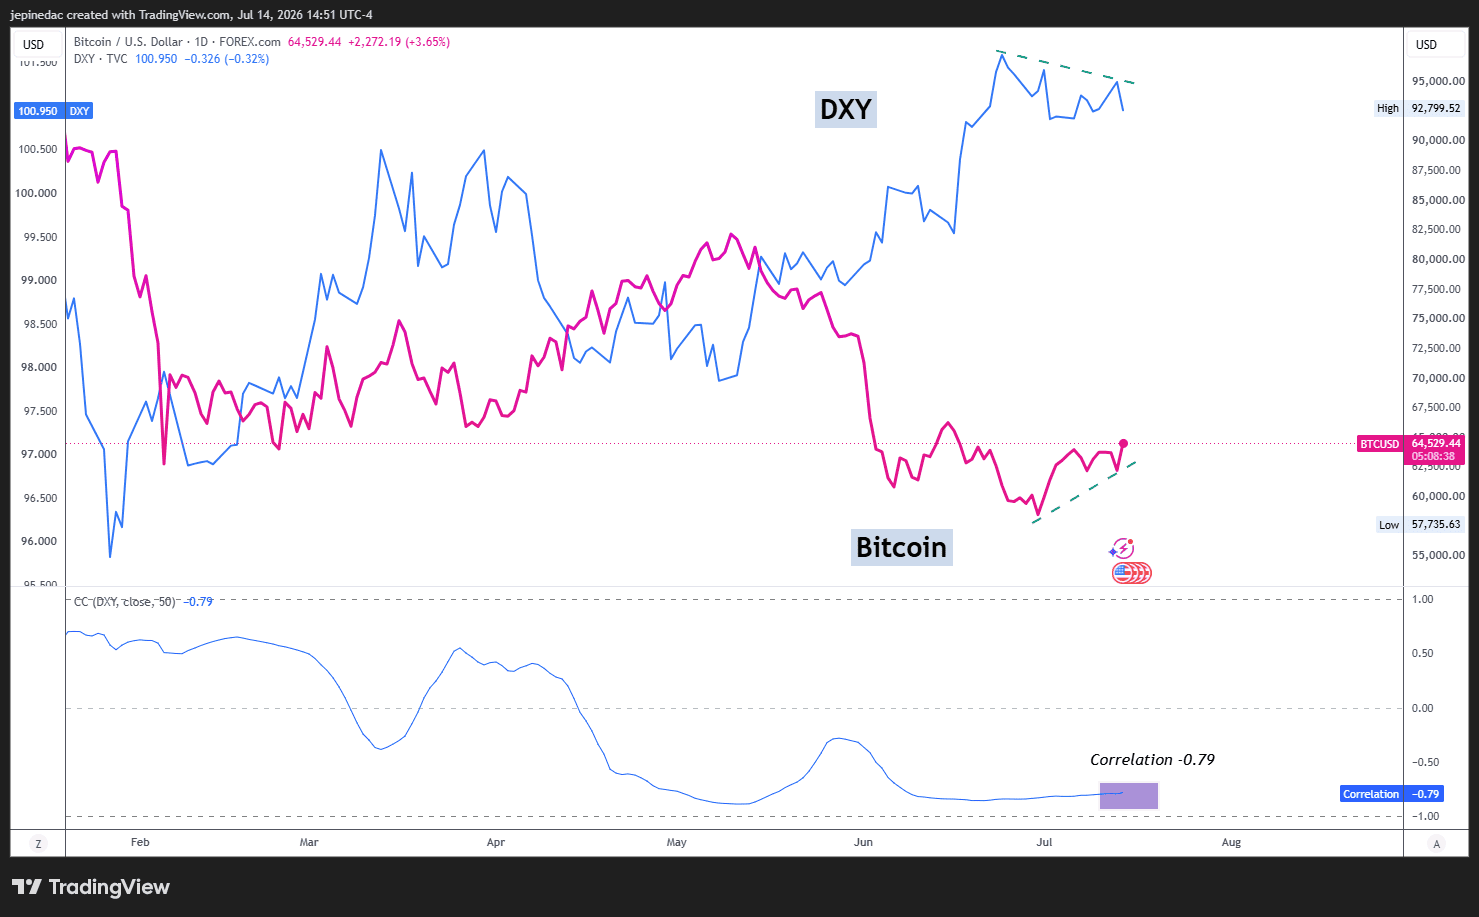
This relationship has remained in place over the last few months of trading. As the U.S. dollar has lost ground in recent sessions, Bitcoin has managed to regain strength. This is reflected in the behavior of the DXY index, which measures the dollar’s strength, and in the current correlation between both assets, which stands at -0.79.
This coefficient shows a relevant inverse relationship over the average of the last 50 sessions. However, it is important to remember that correlation can change over time.
Source: StoneX, TVC, Tradingview
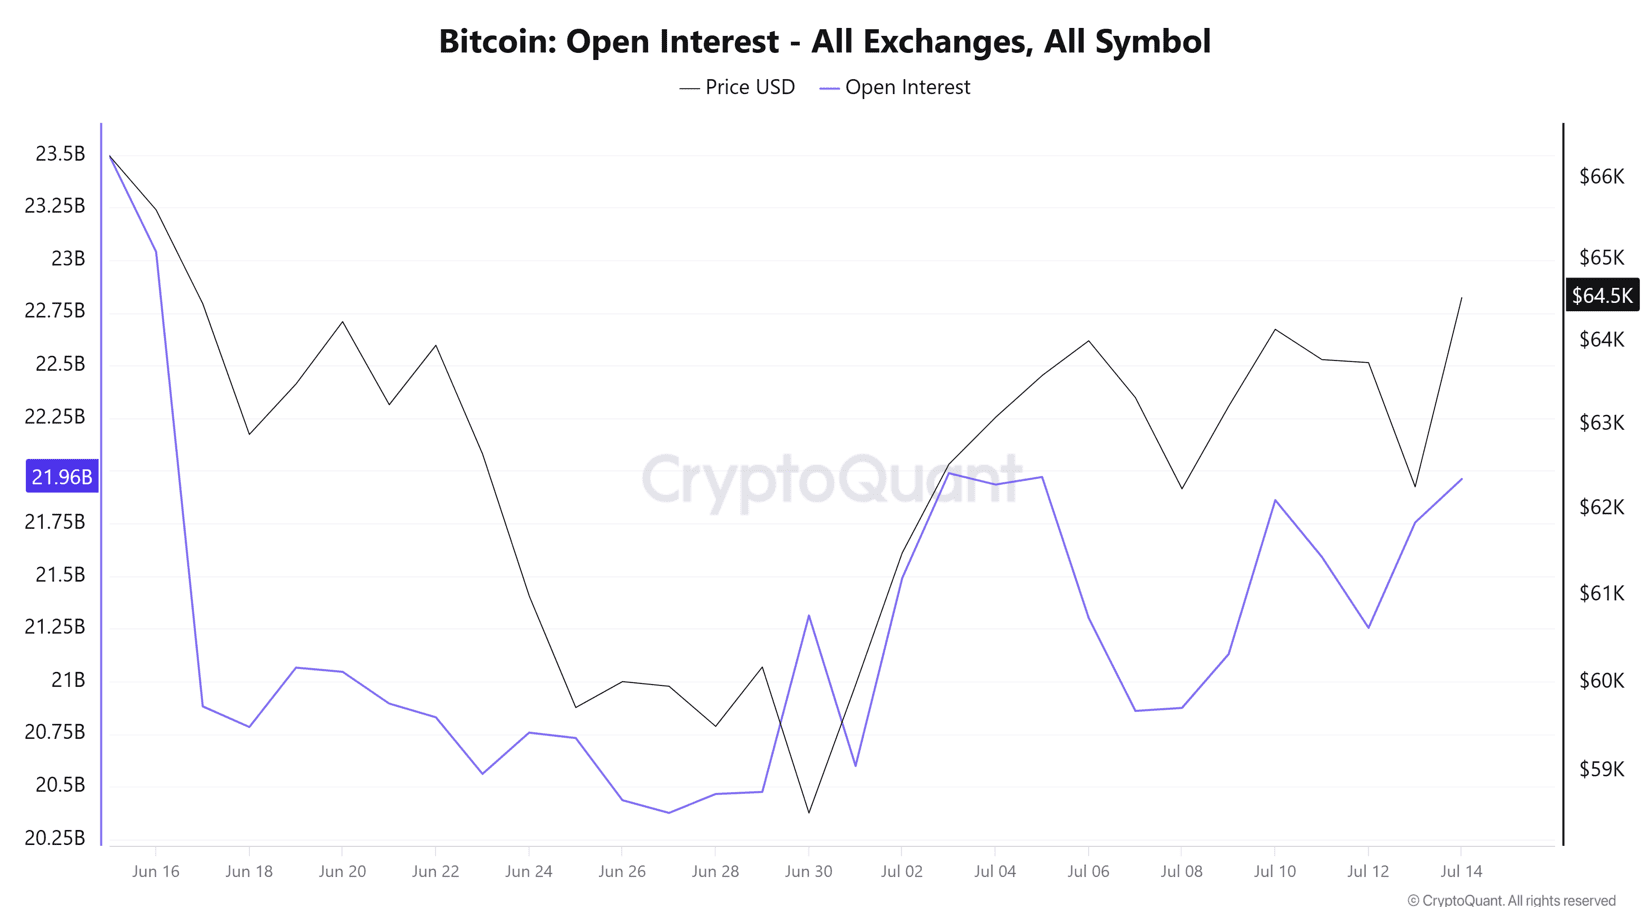
In addition, the dollar’s weakness after the inflation data release has coincided with a new increase in Bitcoin activity. Looking at Open Interest, an indicator that measures the total number of open buy and sell positions across different exchanges, there has been an increase toward the 22 billion area.
This reflects a new inflow of positions into the market. Given that Bitcoin’s price has also appreciated, part of this move could be related to new buying positions. This recovery in demand coincides with the recent weakness of the U.S. dollar, suggesting that Bitcoin is starting to regain appeal as some substitute markets lose ground.
Source: CryptoQuant
Therefore, it is possible that the loss of strength in Bitcoin’s substitute markets is once again supporting the appeal of the crypto market. If this effect continues, demand activity could stabilize in the short term and allow BTC to maintain a more consistent recovery.
In that scenario, relevant buying pressure could remain part of Bitcoin price movements over the next few sessions.
Confidence begins to recover
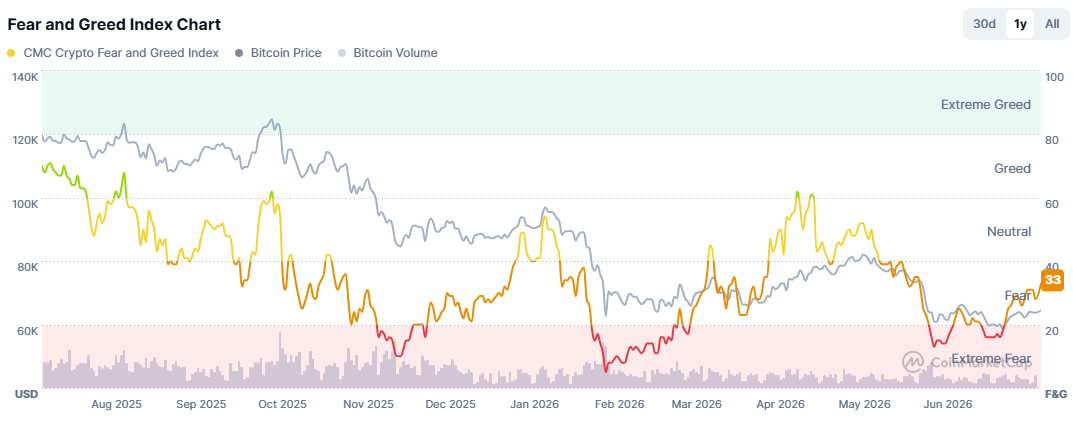
Looking at the recent movements of the cryptocurrency market’s Fear and Greed Index, relevant increases toward the 33-point area stand out in the short term. The indicator maintains an upward slope and is approaching the “neutrality” zone after spending several weeks between “fear” and “extreme fear.” This reflects an important recovery in confidence perception, at least in the short term.
Source: Coinmarketcap
This point is key because, if confidence levels manage to maintain some stability, a more favorable environment for demand could start to form. This could also support more stable buying pressure around BTC over the next few trading sessions.
Technical outlook for Bitcoin
Source: StoneX, Tradingview
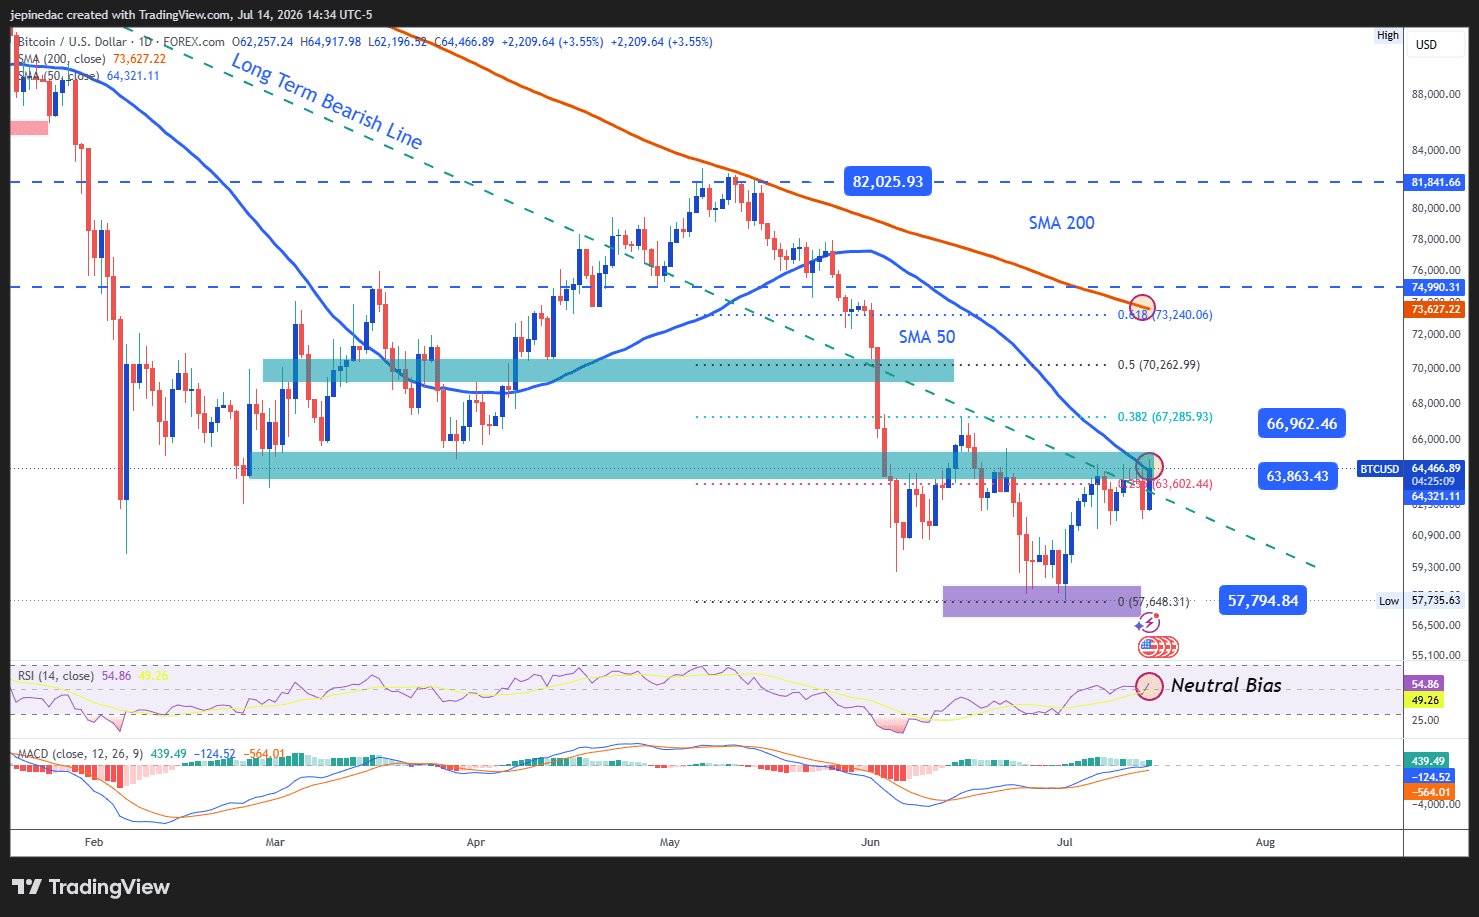
- Long trend line at risk: Although a long bearish trend line has remained in place for months in Bitcoin price movements, the recent price recovery has started to become relevant. Price is now facing the base of this bearish trend line, as well as the barrier formed by the 50-period moving average. If buying pressure manages to hold, this structure could start to come under pressure. This could change the chart structure and open room for a phase of indecision, or even for a more relevant buying bias over the coming weeks.
- MACD: Now, the MACD histogram remains close to the neutral 0 line. This suggests a balance in the strength of short-term moving averages. If this behavior continues, it could reflect an increasingly relevant phase of indecision in the short term.
- RSI: A similar dynamic can be seen in the RSI, as the indicator line remains close to the neutral 50 level. This suggests that the average of bullish and bearish impulses over the last 14 sessions remains balanced. This reading also reflects a phase of indecision that could continue to be relevant in the short term.
Key levels:
- 66,900 – Important resistance: This key bullish barrier corresponds to the area marked by the 38.2% Fibonacci retracement of the most relevant move on the chart. It also remains the most important high-level barrier from previous weeks to watch. Price movements above this level could fully break the dominant bearish trend line and open room for a more relevant buying bias over the coming weeks.
- 63,800 – Near-term barrier: This relevant neutral level corresponds to the base of the long bearish trend line, the 23.6% Fibonacci retracement level, and the 50-period simple moving average. This makes the area the most important short-term retracement reference. For this reason, price movements too close to this level over the next few sessions could highlight an important phase of indecision and even open room for the formation of a more relevant short-term sideways range.
- 57,790 – Definitive support: This area of recent lows coincides with the 2026 lows. Moves below this level could reinforce a dominant selling bias and open room for an important extension of the bearish trend line that has dominated for months of trading.
Written by Julian Pineda, CFA, CMT – Market Analyst
Follow him on: @julianpineda25
Related tags:
Latest market news




The complete CFD trading experience
Award-winning platforms, competitive spreads, low commissions and dedicated support.
We live and breathe the markets and are dedicated to helping traders realise their ambitions as we continue to set the industry bar.
Economic calendar
Web Trader platform
Our sophisticated web-based platform is packed with features.
Related articles

Bitcoin Forecast: Is Buying Demand Making a Comeback?
Recent trading sessions have once again highlighted a meaningful improvement in demand dynamics around Bitcoin. In fact, over the last two sessions the leading cryptocurrency has gained nearly 3.0%, bringing buying momentum back into focus after losing strength in previous weeks.

DJIA and Bitcoin Outlook: Are Charts Facing Contrarian Sentiment Risks?
Risk sentiment has fallen into the extreme-fear zone, sparking contrarian interest and potential dip-buying opportunities. This comes as geopolitical tensions rise again and US bond yields pull back from extreme momentum conditions.


Crypto Analysis: Market Caution Extends Even to Bitcoin
We are now halfway through October, and one of the clearest themes across the cryptocurrency market has been the lack of meaningful price action. The absence of direction has become increasingly evident in short-term trading, and even Bitcoin, the market’s benchmark asset, has failed to generate the type of moves needed to restore confidence across the sector.
StoneX Europe Ltd may make third party material available on this website which may contain information included but not limited to the conditions of financial markets. The material is for information purposes only and does not contain, and should not be construed as containing, investment advice and/or investment recommendation and/or an investment research and/or an offer of or solicitation for any transactions in financial instruments; any decision to enter into a specific transaction shall be made by the client following an assessment by him/her of their situation.
StoneX Europe Ltd makes no representation or warranty and assumes no liability as to the accuracy or completeness of the information provided, nor any loss arising from any investment based on a recommendation, forecast or other information supplied. You should always seek independent advice as to your suitability to speculate in any related markets and your ability to assume the associated risks, if you are at all unsure. We are not under any obligation to update any such material. Any opinion made may be personal to the author and may not reflect the opinion of StoneX Europe Ltd.