



Bitcoin Back to a Familiar Support Level: BTC/USD Levels
Bitcoin has retained strength through the jump in yields even as gold has melted down, but now BTC/USD faces an important test as price has reverted to a significant support level.
Share this:

Bitcoin, BTC/USD Talking Points:
- BTC/USD has held up well of late, all factors considered.
- As looked at previously it appeared as though we’re in one of those periods where the world’s preference for an anti-fiat vehicle has shifted from gold to Bitcoin.
- So far, there’s been a clean hold of support at prior resistance from May – but there’s also been a hold of resistance at the high around 87,300 helping to develop a rather consistent range.
It was the Treasury buyback announcement that lit the Bitcoin market on fire, and in the month-and-a-half since, there’s been a noticeable shift from investors into the cryptocurrency and away from gold. The fact that BTC/USD has held up as well as it has, even with global yields flying higher, is a fact that should be respected. But we’re now at the point where the proverbial rubber meets the road as Bitcoin is testing a significant support level that has some historical relevance.
The level of 82,833 set the high back in May. In the week after that high, a series of lower-highs led to a breakdown and, eventually, a test of the 60k handle in July.
More recently, and perhaps more importantly, is how the level came into play last week. As gold sold off into and around the Fed’s rate hike, Bitcoin continued to power-higher, setting a fresh eight-month-high the week after the move. At that point, with a heavy bullish bias there was ample motive for sellers to drive a sizable pullback. But it was the 82,833 level where bulls took a stand, establishing a higher-low that, eventually, led to another rally.
Bitcoin (BTC/USD) Daily Price Chart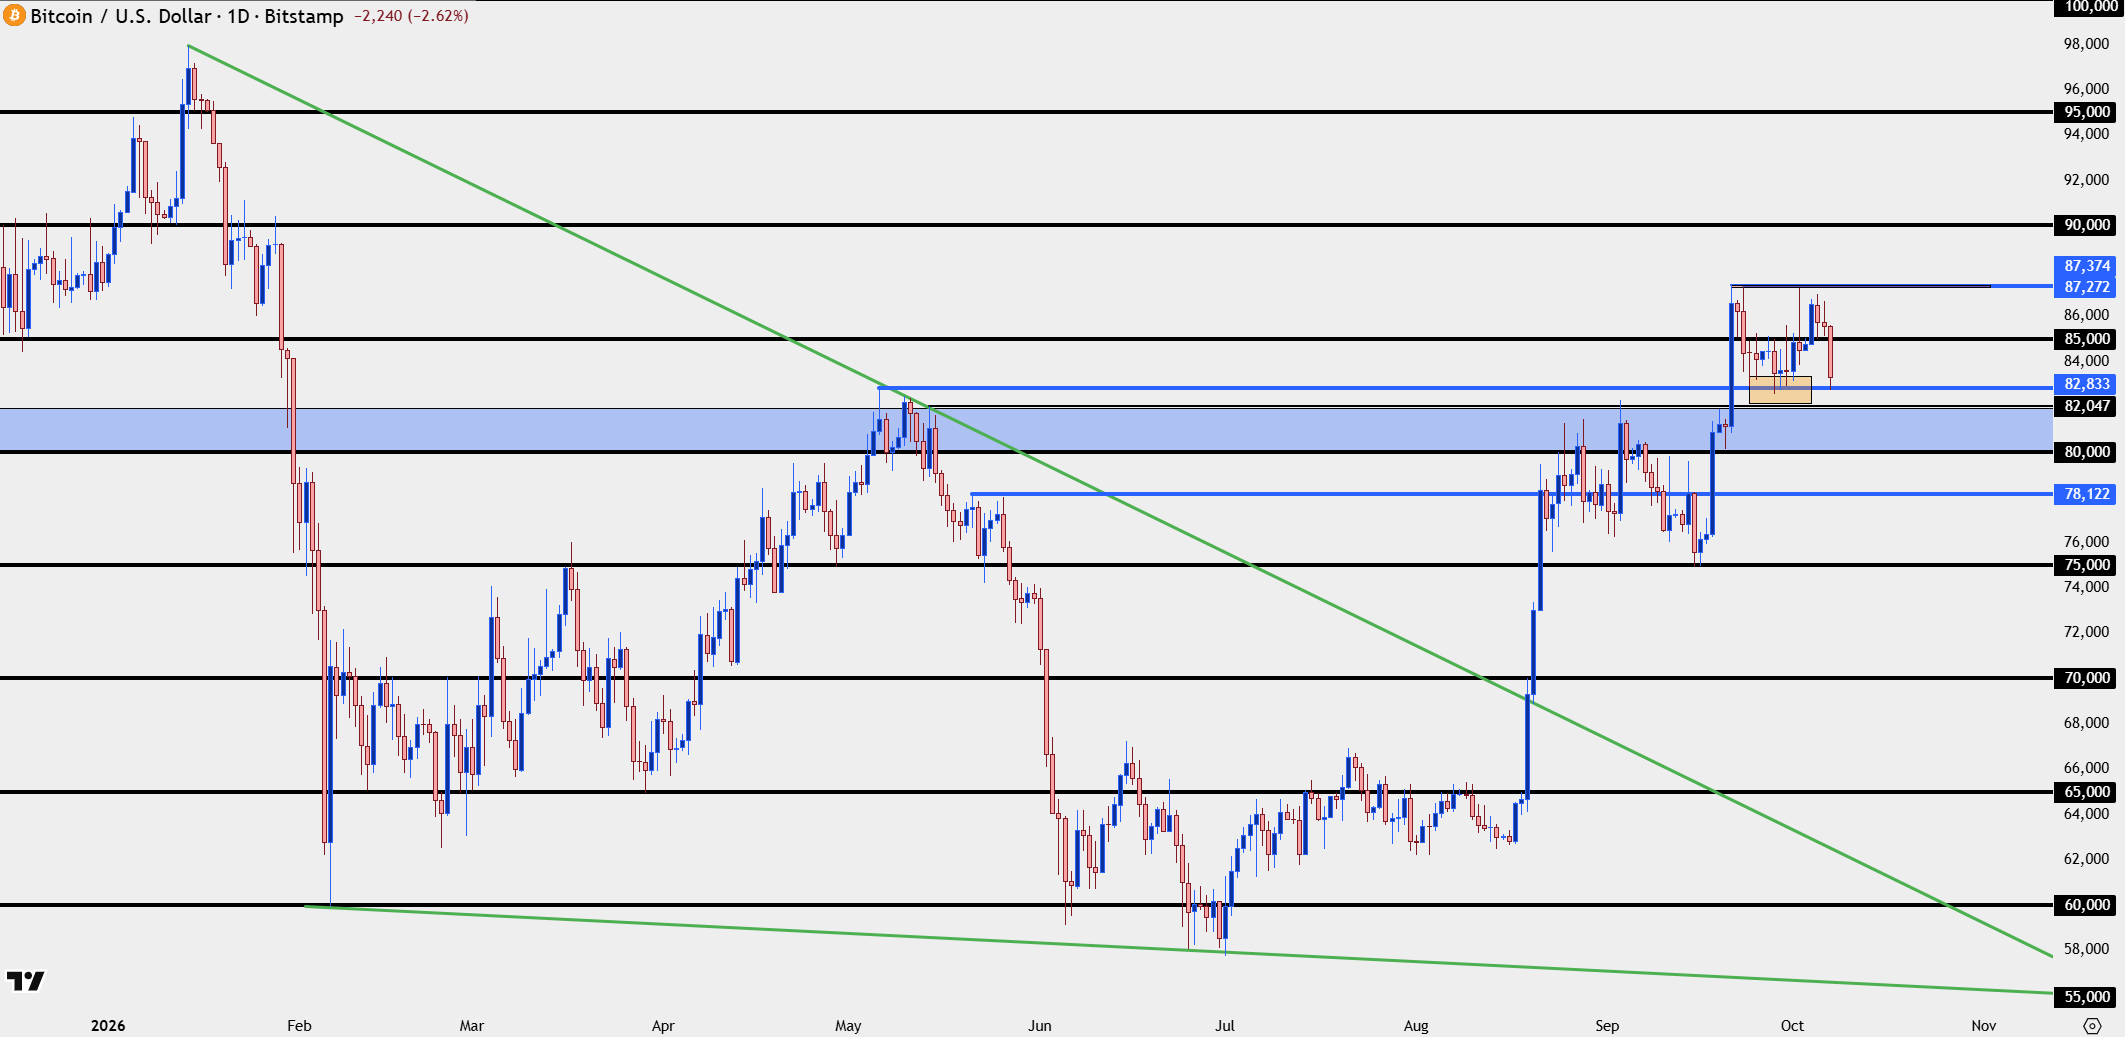
Chart prepared by James Stanley; data derived from Tradingview
Bitcoin Big Picture
From the weekly chart this is an important spot and an important time for BTC/USD. The breakout is still fresh and while invalidation doesn’t exist until 75k, the weekly bar closing as bearish as it looks now would be foreboding, and would highlight the potential for a deeper drawdown to the 80k level.
BTC/USD Weekly Chart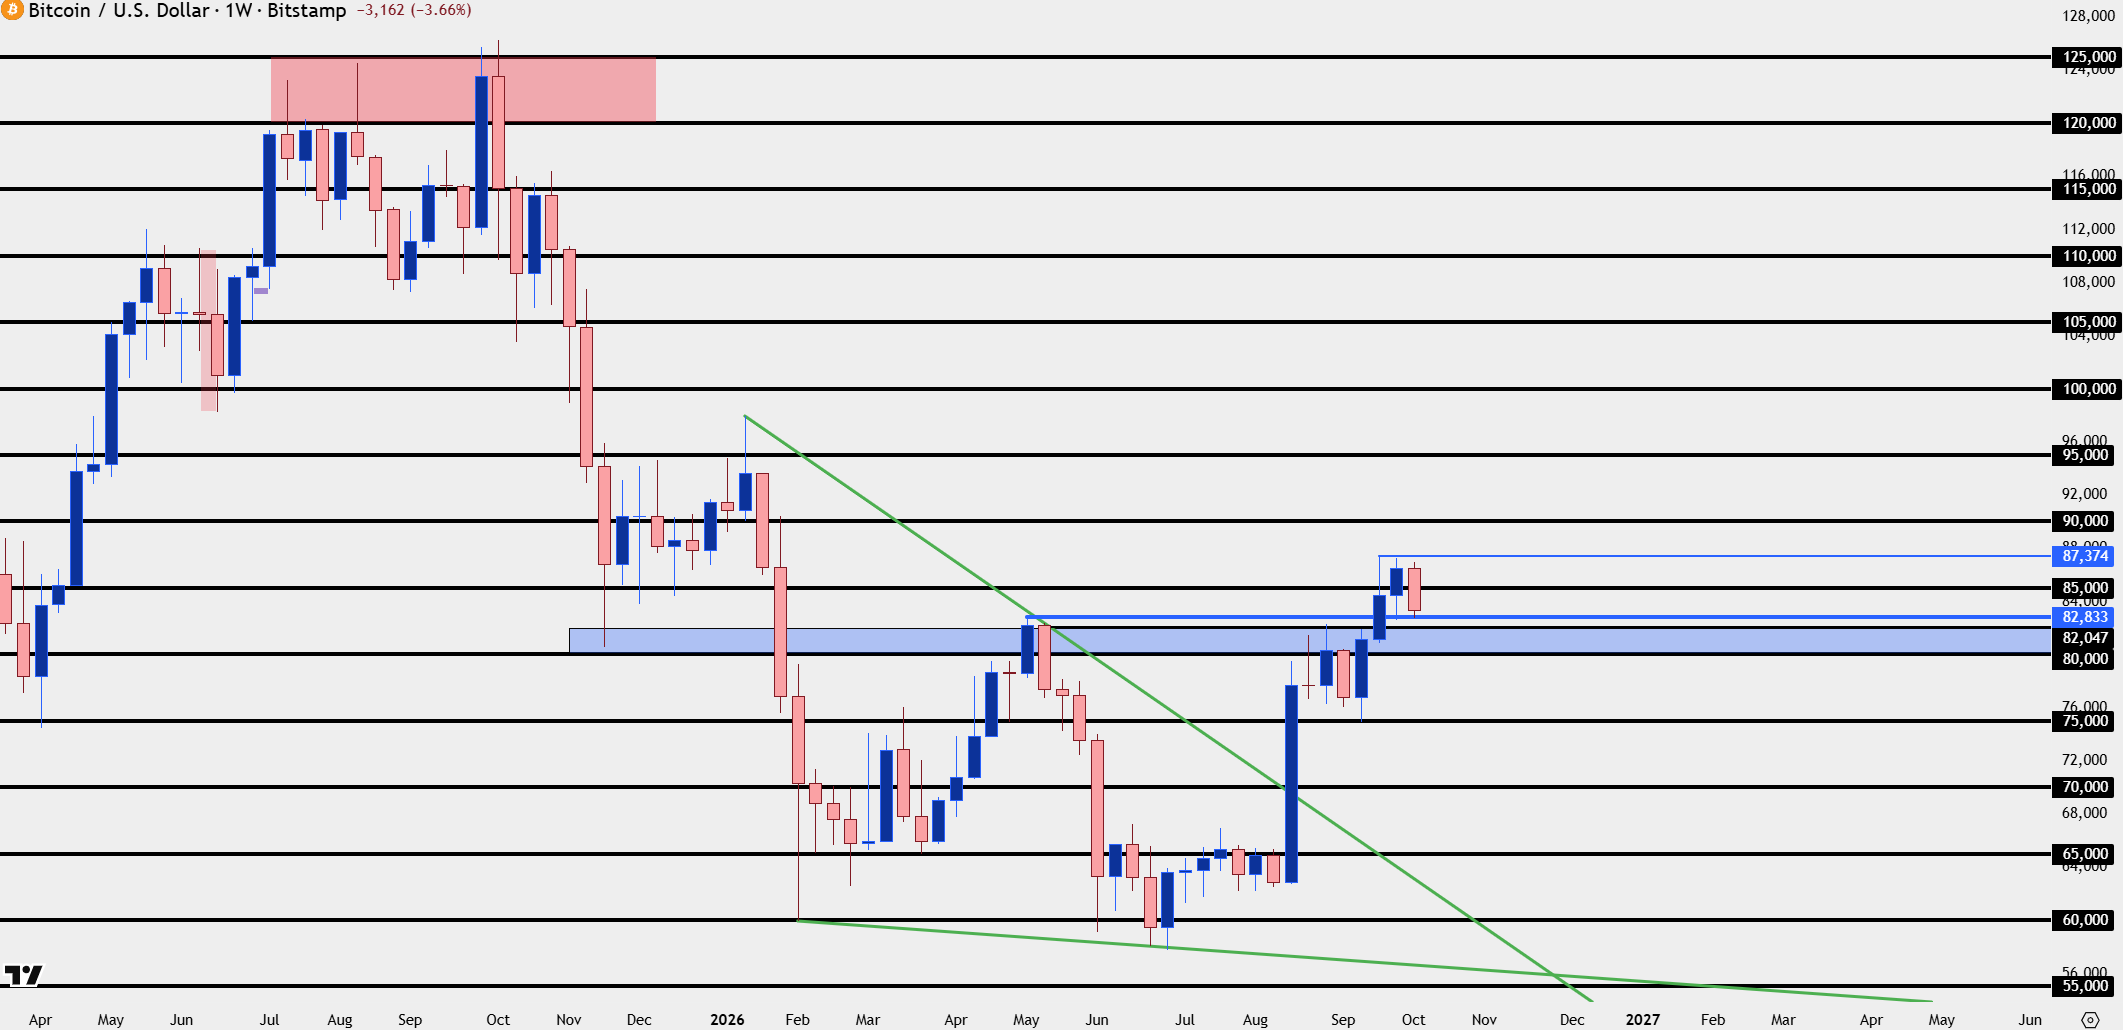
Chart prepared by James Stanley; data derived from Tradingview
Bitcoin Structure
What made the prior support test last week so important is how buyers responded to it – posing a series of higher-lows as the level was defended. I’ve added a green trendline to illustrate that.
For the more recent test, it’s still early and from the four-hour below, we have just one test of that price at 82,833. But – given the recent range the door is open for continuation. And if there is a break of support, deeper support potential exists at the 82,047 or the 80k handle just below that. If 80k is lost, then 75k becomes the big marker as that held a massive spot back in September, just before the FOMC rate hike.
Losing that opens the door for a steeper slide and that would be seen as a large failure from bulls.
Bitcoin Four-Hour Chart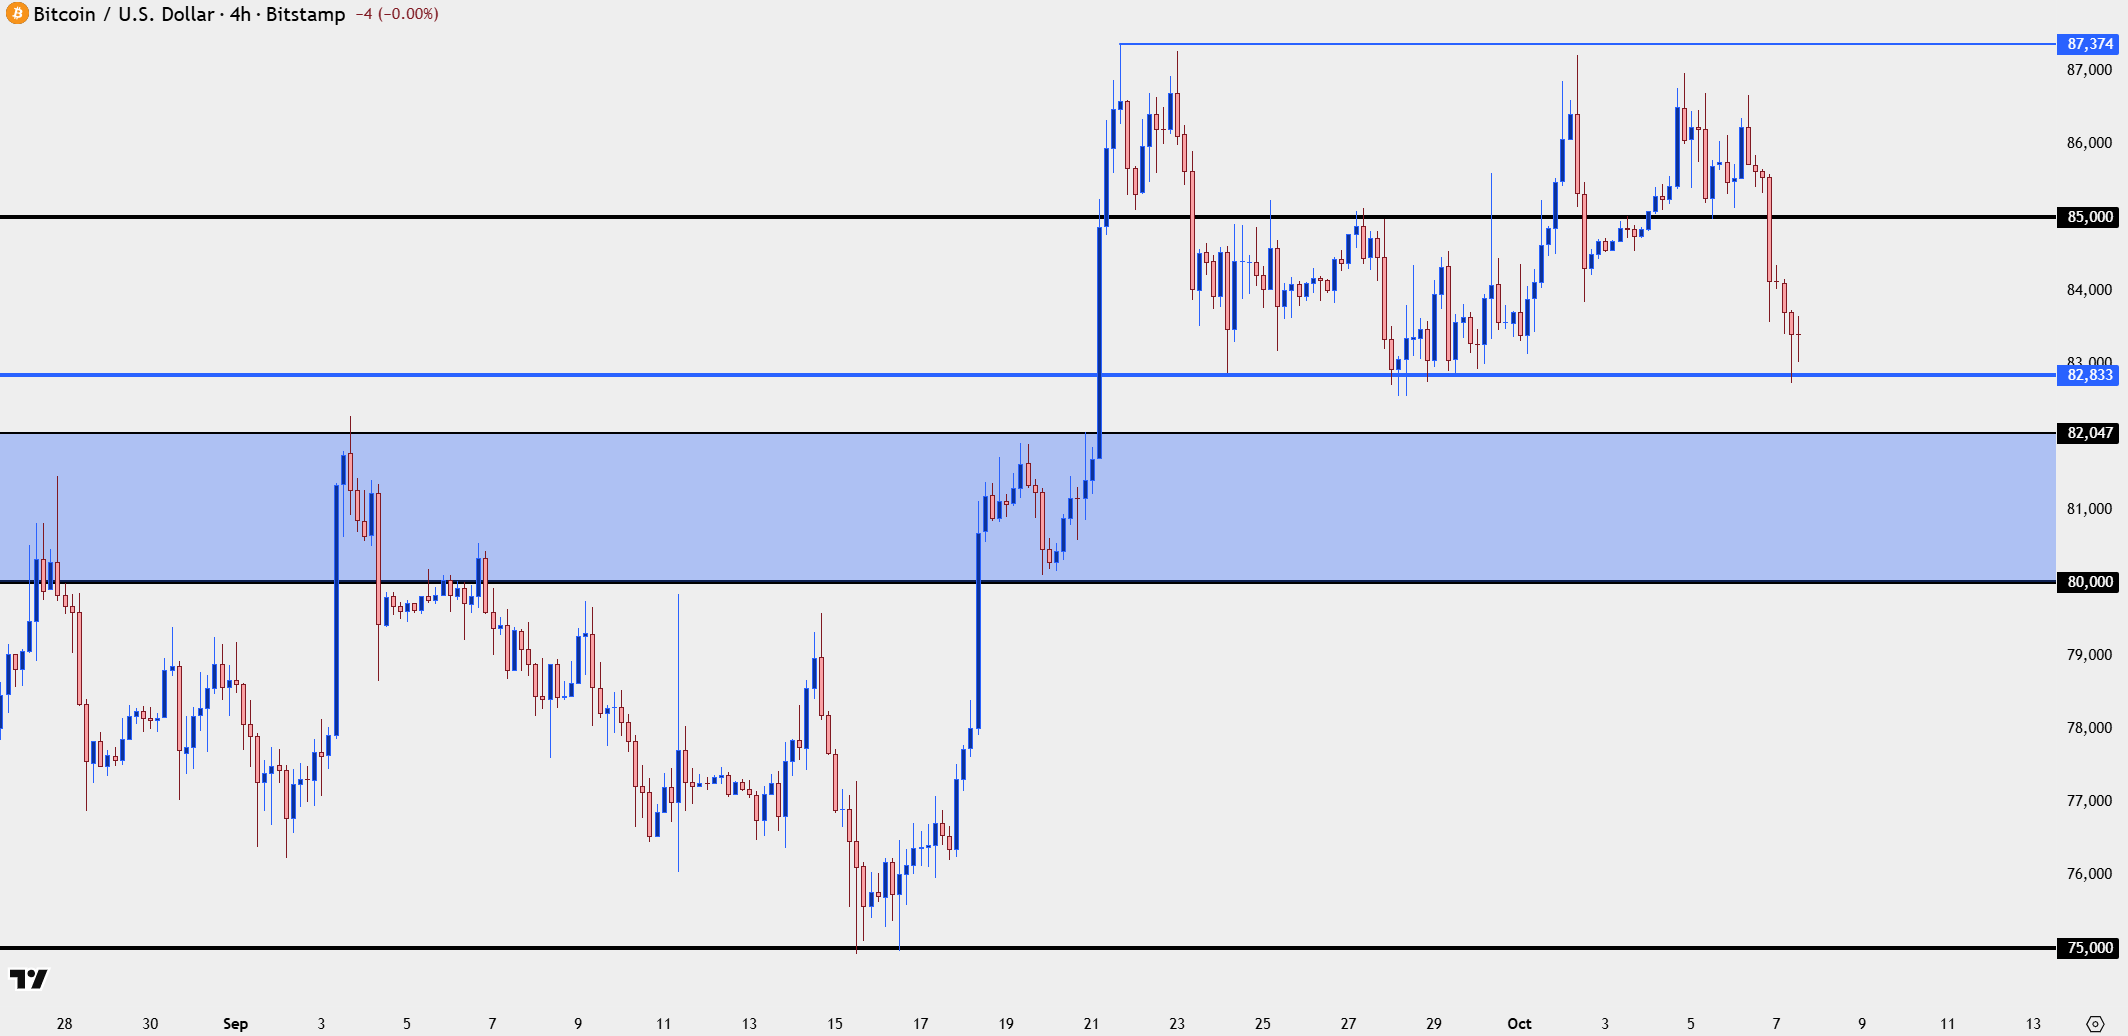
Chart prepared by James Stanley; data derived from Tradingview
--- written by James Stanley, Senior Market Analyst, Global Macro
Related tags:



The complete CFD trading experience
Award-winning platforms, competitive spreads, low commissions and dedicated support.
We live and breathe the markets and are dedicated to helping traders realise their ambitions as we continue to set the industry bar.
Economic calendar
Web Trader platform
Our sophisticated web-based platform is packed with features.
Related articles
BTC/USD Outlook: Bitcoin defies macro headwinds as volatility evaporates
Bitcoin has weathered the surge in the US dollar and Treasury yields remarkably well, but realised volatility has fallen towards historical lows. A study of nearly a decade of price history suggests larger swings may be coming.
Bitcoin Back to a Familiar Support Level: BTC/USD Levels
Bitcoin has retained strength through the jump in yields even as gold has melted down, but now BTC/USD faces an important test as price has reverted to a significant support level.

EUR/USD Tests Most Oversold Levels in a Decade
It’s been a painful run for EUR/USD as the pair has lost more than 500 pips in a month and a half, but with the pair now deeply oversold the big question is whether sellers can stretch.
StoneX Europe Ltd may make third party material available on this website which may contain information included but not limited to the conditions of financial markets. The material is for information purposes only and does not contain, and should not be construed as containing, investment advice and/or investment recommendation and/or an investment research and/or an offer of or solicitation for any transactions in financial instruments; any decision to enter into a specific transaction shall be made by the client following an assessment by him/her of their situation.
StoneX Europe Ltd makes no representation or warranty and assumes no liability as to the accuracy or completeness of the information provided, nor any loss arising from any investment based on a recommendation, forecast or other information supplied. You should always seek independent advice as to your suitability to speculate in any related markets and your ability to assume the associated risks, if you are at all unsure. We are not under any obligation to update any such material. Any opinion made may be personal to the author and may not reflect the opinion of StoneX Europe Ltd.