



Bitcoin, Nasdaq Price Outlook: Risk-On Sentiment Hinges on a US-Iran Nuclear Deal
Bitcoin and Nasdaq remain capped below key resistance levels as markets await developments surrounding a potential US-Iran nuclear deal. Explore key support levels, resistance zones, and bullish and bearish scenarios.
Share this:

Risk-on sentiment remains heavily dependent on developments surrounding a potential nuclear agreement between the United States and Iran. As a result, the latest bullish rebound across markets remains capped below key resistance levels that will likely determine whether the next move is a renewed drawdown or a confirmed bullish breakout.
From a sentiment perspective, both crypto and traditional financial markets continue to reflect elevated caution. The Crypto Fear & Greed Index remains in Extreme Fear territory, while the CNN Fear & Greed Index also points toward fear-driven market conditions.
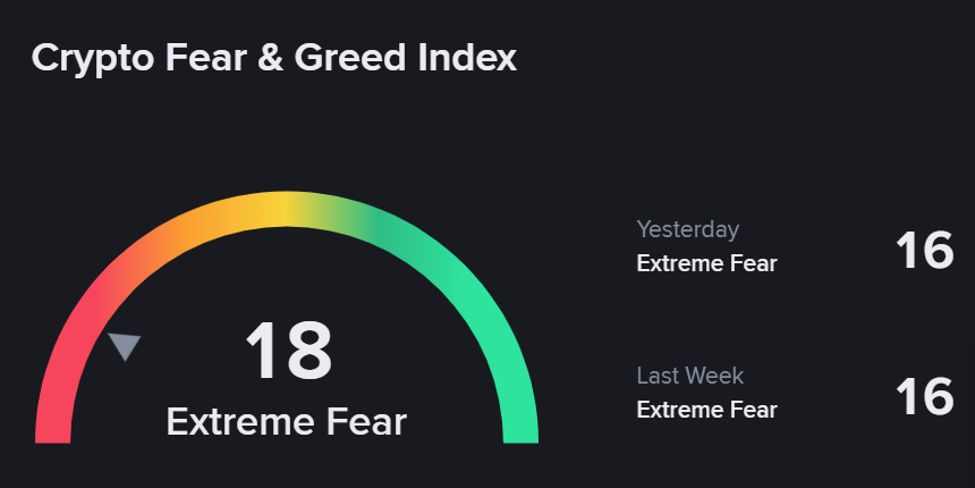
Source: Binance
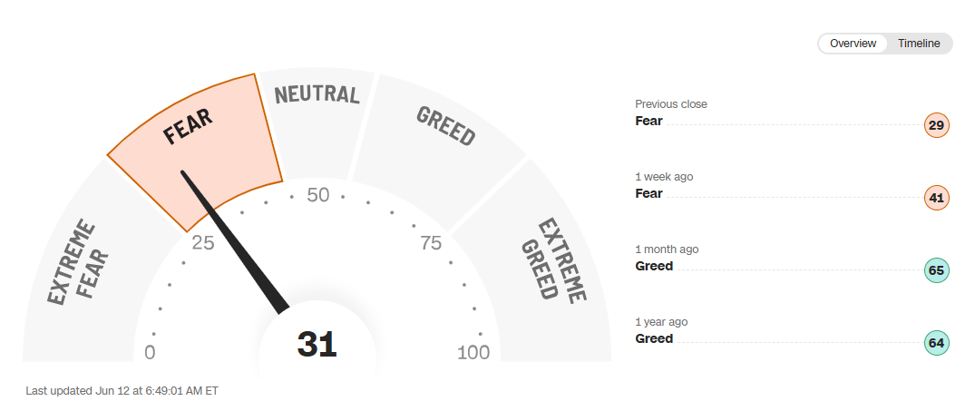
Source: CNN
This highlights the continued dominance of bearish frameworks across major charts as investors wait for greater clarity regarding a potential agreement between the United States and Iran. Given the sharp swings triggered by recent headlines, markets remain cautious despite the continued decline in crude oil prices. WTI crude oil is trading near $82 per barrel, while Bitcoin remains capped below 65,000 and the Nasdaq continues to struggle below the 29,700 resistance level.
Key Events to Watch
- SpaceX's IPO debuts on Nasdaq following today's opening bell, increasing volatility risks across broader markets as traders assess AI-related sentiment and evolving Middle East developments.
- Potential rejection of a peace agreement by Iran.
- Hawkish central bank positioning ahead of next week's policy meetings, including the Fed
- Broader AI-related market sentiment and valuation trends.
Key Levels to Watch
Nasdaq
- Resistance: 29,700
- Support: 28,600
Bitcoin
- Resistance: 65,000
- Support: 59,000
I discuss these charts live during my daily MENA Market Call webinar.
Register for the next webinar here: Registration
Bitcoin Price Outlook: Weekly Time Frame – Log Scale
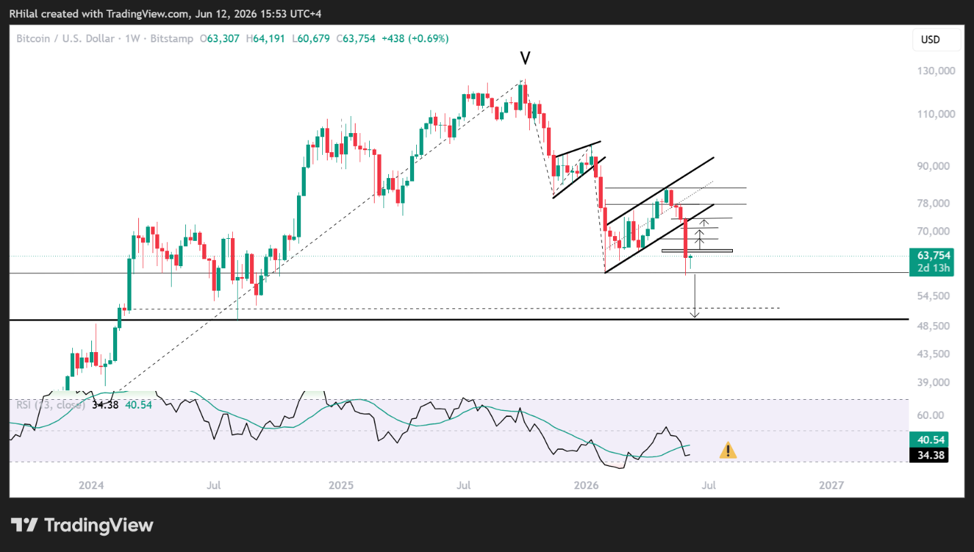
Source: TradingView
Dominant Framework: Bitcoin Remains Under Pressure Below 65,000
Bitcoin remains under pressure below the 65,000 resistance zone despite rebounding from the new yearly low near 59,000.
The recovery remains fragile and closely tied to broader market sentiment, particularly the interaction between AI-related valuations and developments in the Middle East, both of which continue to influence liquidity conditions across risk assets.
Bearish Scenario
A breakdown below the 59,000 support level could expose Bitcoin to another decline of approximately 10,000 points, targeting the 49,000–50,000 zone.
This area aligns with the August 2024 lows and may offer another attractive long-term dip-buying opportunity for investors.
At the same time, weekly momentum indicators continue to show signs of a potential rebound from oversold conditions that have been developing since 2022.
Bullish Scenario: Reclaiming 65,000 Resistance
If bullish momentum strengthens and Bitcoin closes decisively above 65,000, attention would shift toward the next resistance levels near:
- 68,000
- 71,000
- 74,000
This setup mirrors the technical framework currently developing in silver.
A sustained breakout above these levels would significantly strengthen the bullish case, opening the path toward the 90,000 region and potentially new record highs over the longer term.
Nasdaq Price Outlook: Weekly Time Frame – Log Scale
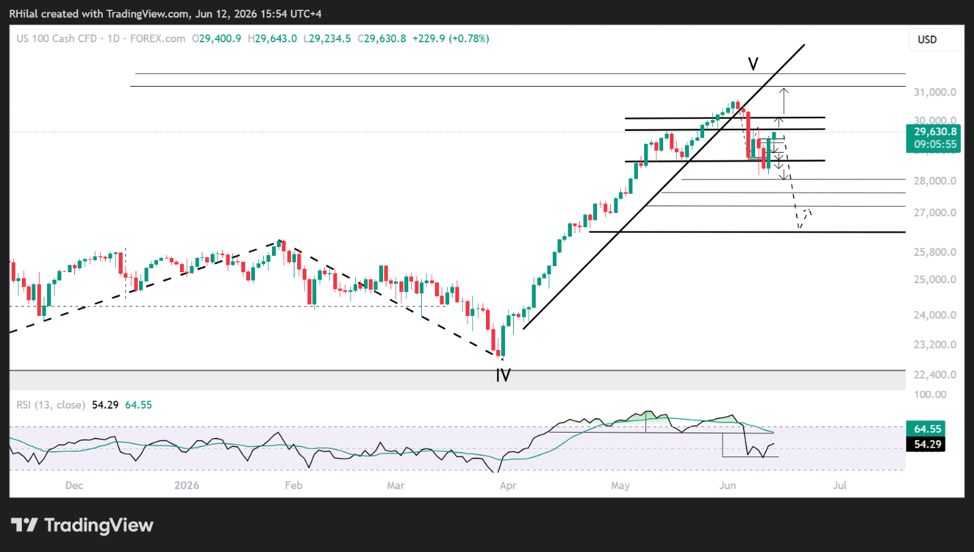
Source: TradingView
Dominant Framework: Nasdaq Remains in Correction Mode Below 29700
The Nasdaq remains in a corrective phase following the strong rally from March through June.
Price action continues to hold near the 78.6% Fibonacci extension of the June cycle while remaining above the key 28,200 support zone.
Key Support Levels to Monitor
The index continues to fluctuate around the 28,600 level.
A renewed breakdown below this area, combined with a sustained move beneath the 28,200 support zone, would reinforce bearish momentum.
Momentum indicators remain below their neutral levels and are approaching yearly oversold territory, increasing the risk of a decline toward the next support zones at:
- 27,700
- 27,200
- 26,400 - 61.8% of the April - June rally
These levels may provide potential dip-buying opportunities should selling pressure intensify.
Liquidity Risks Around the SpaceX IPO
Additional volatility may emerge as markets digest the launch of the SpaceX IPO, which could trigger temporary liquidity rebalancing across equity markets.
As one of the largest public offerings in history, with an estimated valuation of $1.75 trillion, the listing may temporarily influence market positioning, risk allocation, and investor sentiment.
Bullish Scenario: Reclaiming 29,700 Resistance
If bullish momentum returns and the Nasdaq successfully reclaims the 29,700 resistance zone, attention would shift toward the next upside targets at:
- 30,100
- 30,400
A sustained breakout above these levels would strengthen the case for a renewed rally toward record highs and potentially open the path toward the 31,700 region.
Written by Razan Hilal, CMT
Follow on X: @Rh_waves


The complete CFD trading experience
Award-winning platforms, competitive spreads, low commissions and dedicated support.
We live and breathe the markets and are dedicated to helping traders realise their ambitions as we continue to set the industry bar.
Economic calendar
Web Trader platform
Our sophisticated web-based platform is packed with features.
Related articles

Gold Price Forecast: XAU/USD 17% Plunge Threatens Multi-Year Uptrend 10 31 2026
Gold bears are closing in on critical multi-year trend support, with a potential exhaustion low in focus as November trading gets underway.


Crypto Outlook: Is Binance Attack Hurting Market Confidence?
As October comes to an end and the cryptocurrency market enters the final stretch of 2026, a renewed phase of weakness is becoming increasingly evident across the sector. Most major cryptocurrencies have struggled to maintain consistent demand and have once again started to underperform compared with other financial markets.


Bitcoin Price Forecast: BTC/USD 12.5% Plunge Nears Critical Support 10 30 2026
Bitcoin bears are closing in on critical trend support as a reported Binance security breach rattles sentiment, raising the stakes for November.
StoneX Europe Ltd may make third party material available on this website which may contain information included but not limited to the conditions of financial markets. The material is for information purposes only and does not contain, and should not be construed as containing, investment advice and/or investment recommendation and/or an investment research and/or an offer of or solicitation for any transactions in financial instruments; any decision to enter into a specific transaction shall be made by the client following an assessment by him/her of their situation.
StoneX Europe Ltd makes no representation or warranty and assumes no liability as to the accuracy or completeness of the information provided, nor any loss arising from any investment based on a recommendation, forecast or other information supplied. You should always seek independent advice as to your suitability to speculate in any related markets and your ability to assume the associated risks, if you are at all unsure. We are not under any obligation to update any such material. Any opinion made may be personal to the author and may not reflect the opinion of StoneX Europe Ltd.