



Bitcoin Outlook: Bullish Breakout in Sight?
Bitcoin Outlook: Bitcoin prices have climbed to three-month highs, once again approaching the 100,000-mark, following a three-month consolidation above the 80,000 level. This price behavior places Bitcoin back in focus as it tests a key psychological threshold.
Share this:

Key Events
- Bitcoin prices are facing the risk of a sharp bullish breakout following a three-month consolidation above the 80,000 level.
- Ongoing institutional adoption and favorable regulatory developments are improving bullish sentiment across Bitcoin and leading cryptocurrencies, despite heightened global geopolitical uncertainty and broader risk aversion.
Markets are navigating 2026 in a state of heightened sensitivity. Softening US economic data and the start of earnings season are colliding with a widening geopolitical risk premium, spanning renewed US–Greenland acquisition discussions, regime reformation risks in the Middle East following the fall of Maduro in Venezuela, and persistent Russia–Ukraine tensions.
These overlapping risks are unfolding at a time when price action across major asset classes is already stretched, including US indices and precious metals. Against this backdrop, Bitcoin’s consolidation since November 2025 from the 80,000 lows appears to be leaning toward a constructive breakout. Expectations for favorable regulatory progress, alongside rising institutional adoption across the crypto space—including increased participation from major US banks—are supporting this narrative.
As a result, Bitcoin’s haven-like attributes may be re-emerging, particularly as risk appetite across equity indices remains muted amid elevated valuations, stretched momentum, and heightened macro uncertainty.
Bitcoin Outlook: 3-Day Time Frame – Log Scale
Source: Trading view
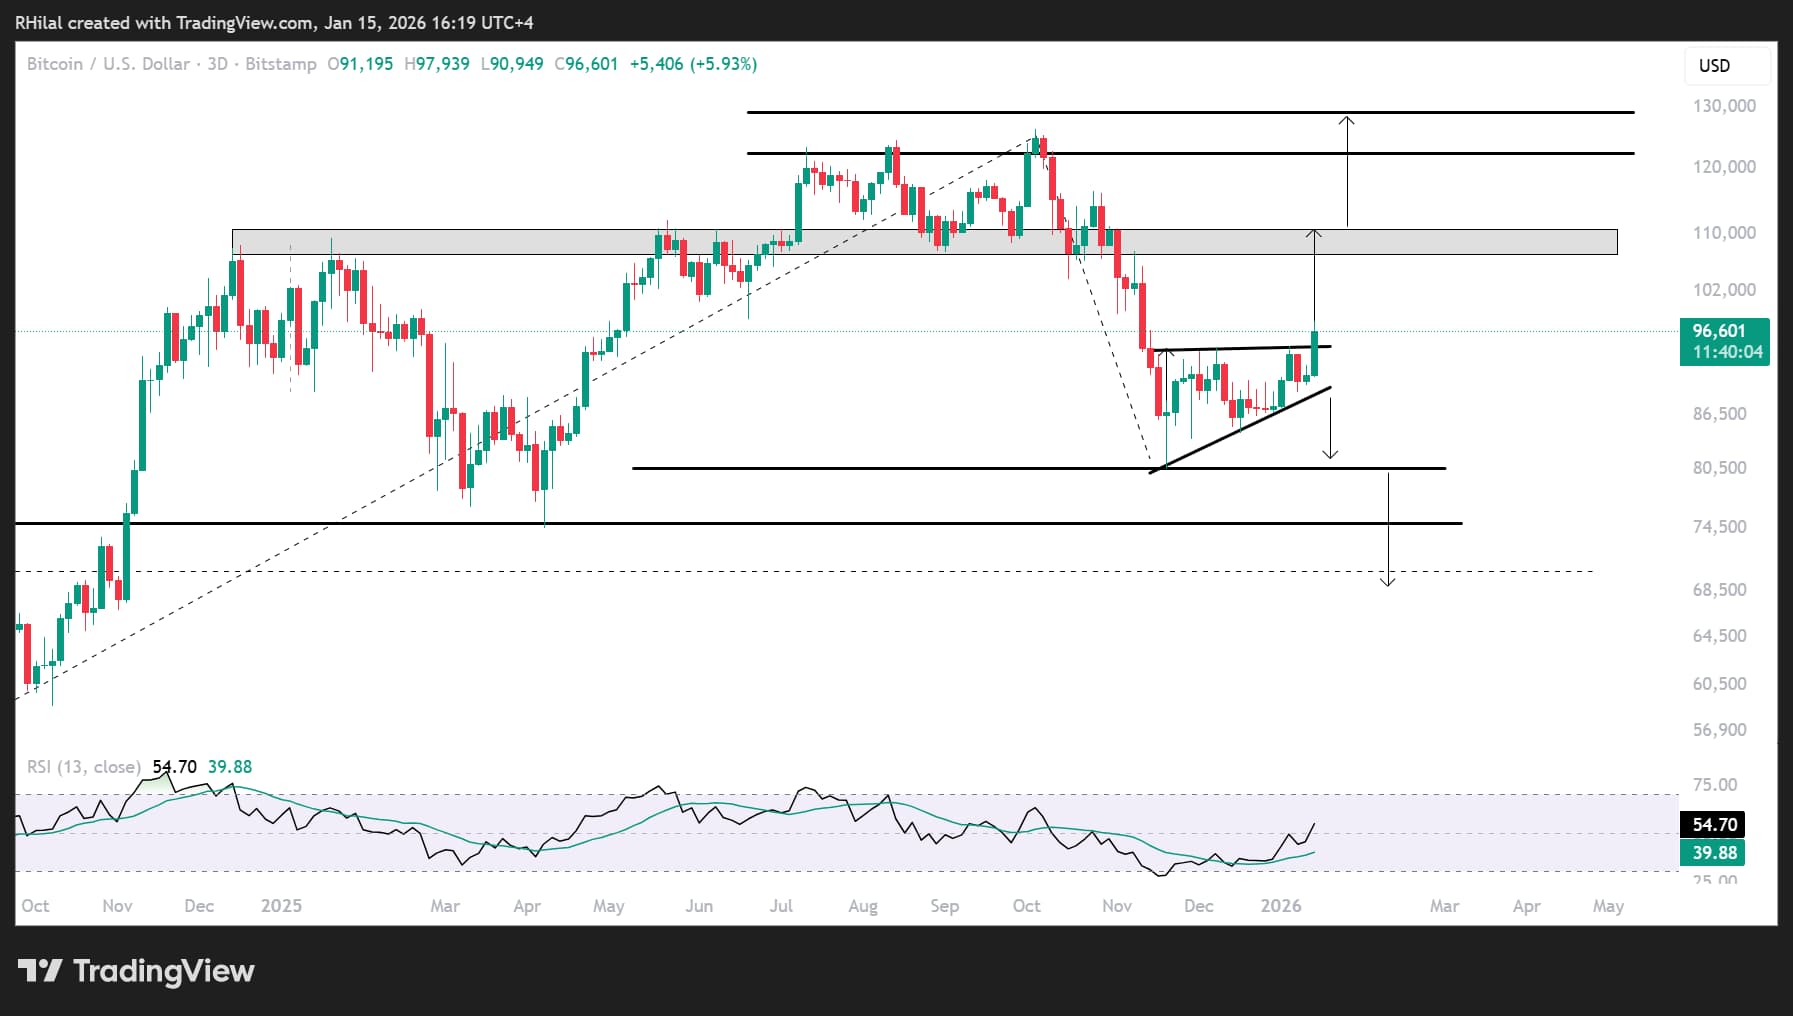
From a three-day timeframe perspective, Bitcoin has been consolidating since November 2025 above the 80,000 support and below the 94,000 resistance, forming an ascending triangle pattern. A recent bullish signal is emerging, supported by RSI holding above the 50 neutral level and sustained price action above the 95,000 zone.
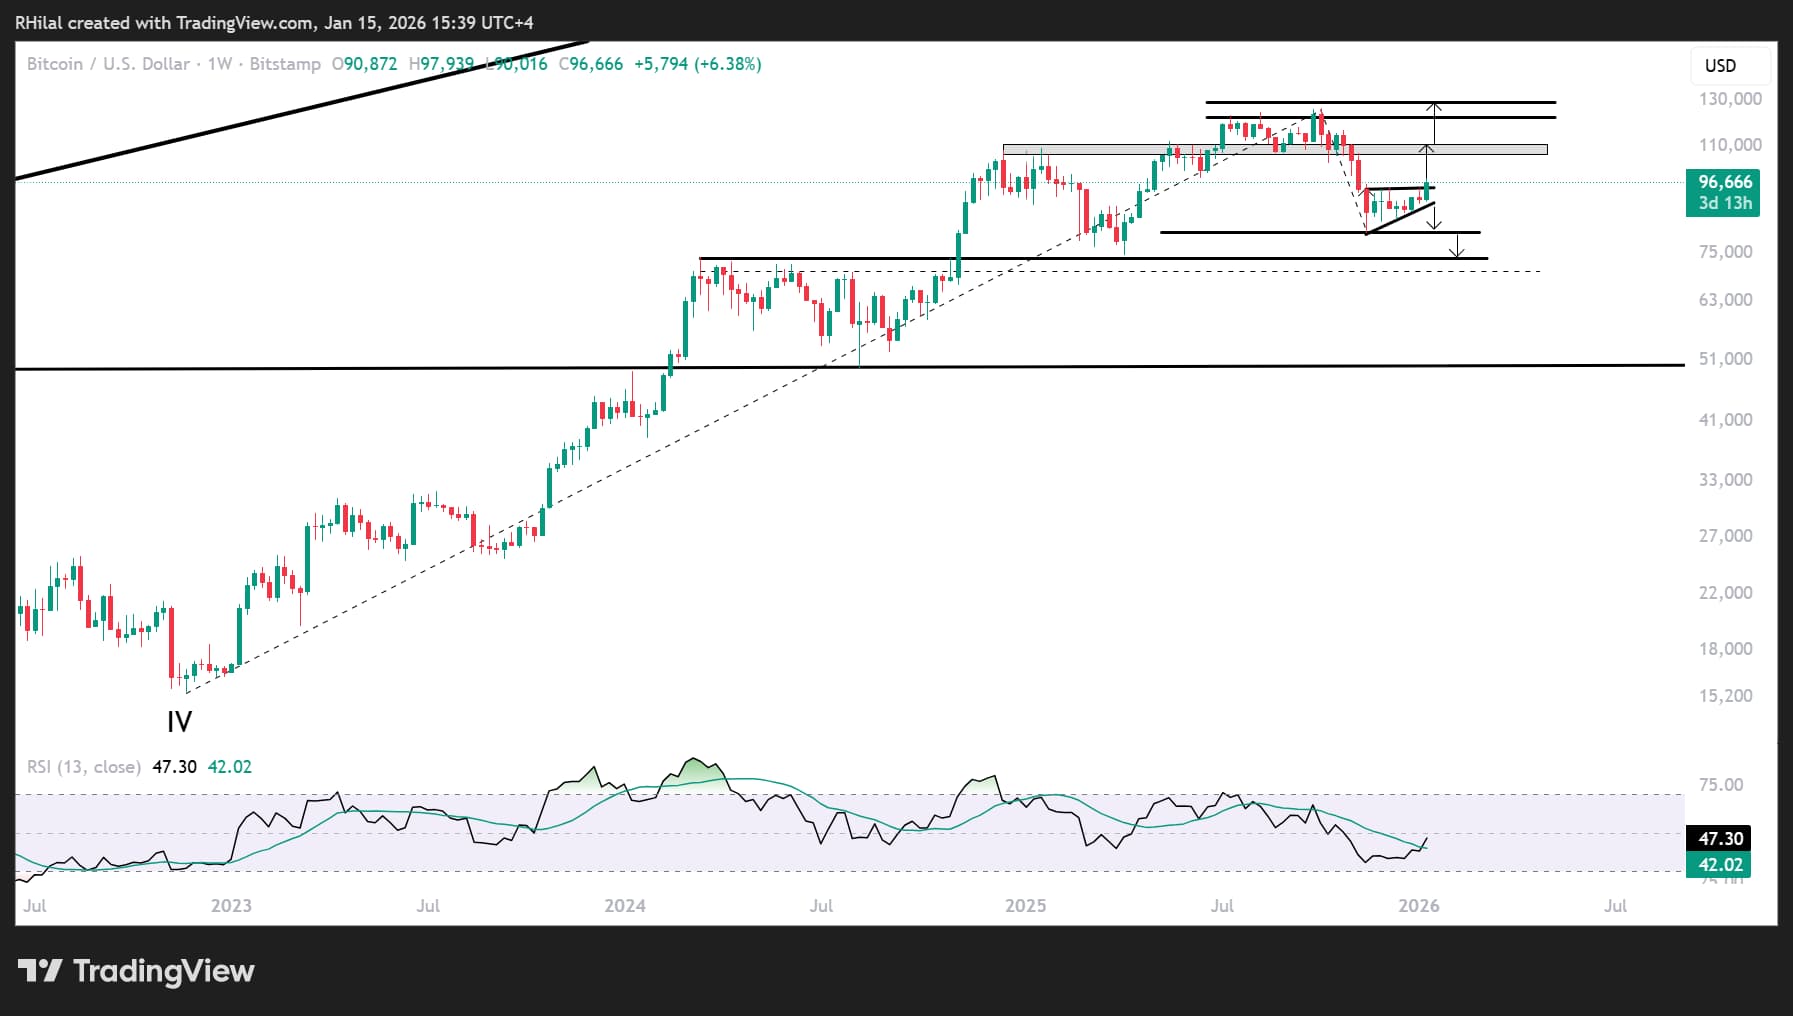
A clean hold above this region is expected to extend the move toward the 110,000 level initially, followed by a retest of the 126,000 record high, before confirming a broader breakout toward the 130,000, 135,000, and 150,000 levels. These projections are derived using the Fibonacci extension tool, applied to the broader trend originating from the November 2022 lows, as illustrated in the weekly chart below.
Bitcoin Outlook: Weekly Time Frame – Log Scale
Source: Trading view
The cycle connecting the 2022 lows and the 2025 highs appears structurally intact, allowing the trend between the November 2022 low, October 2025 high, and November 2025 low to be used for measuring upside and downside scenarios via Fibonacci tools. Fibonacci extension levels on the upside align with the 0.272, 0.5, and 0.618 ratios, at 126,000, 135,000, and 150,000.
On the downside, a move below the 80,000 barrier exposes retracement levels at 74,000, 68,600, and 56,000, which may represent potential dip-engagement zones within the broader cycle, aligned with longer-term expectations towards the 200,000 mark.
Written by Razan Hilal, CMT
Follow on X: @Rh_waves
Related tags:



The complete CFD trading experience
Award-winning platforms, competitive spreads, low commissions and dedicated support.
We live and breathe the markets and are dedicated to helping traders realise their ambitions as we continue to set the industry bar.
Economic calendar
Web Trader platform
Our sophisticated web-based platform is packed with features.
Related articles
British Pound Technical Outlook: GBP/USD Rebound Challenges September Downtrend 9 30 2026
Sterling has rallied sharply from key support, with GBP/USD at an inflection point that could determine whether a larger recovery is underway.

Treasury Yields Lose Momentum as Energy ETF Retreats
The 10-year Treasury yield is testing a resistance zone respected since the 1920s, as bearish RSI divergence signals fading upside momentum.

NZD/USD pressure mounts as payrolls looms large
NZD/USD has fallen sharply as Fed rate expectations reset higher, but extreme downside stretch and major support raise the risk of a violent counter-trend rebound.

StoneX Europe Ltd may make third party material available on this website which may contain information included but not limited to the conditions of financial markets. The material is for information purposes only and does not contain, and should not be construed as containing, investment advice and/or investment recommendation and/or an investment research and/or an offer of or solicitation for any transactions in financial instruments; any decision to enter into a specific transaction shall be made by the client following an assessment by him/her of their situation.
StoneX Europe Ltd makes no representation or warranty and assumes no liability as to the accuracy or completeness of the information provided, nor any loss arising from any investment based on a recommendation, forecast or other information supplied. You should always seek independent advice as to your suitability to speculate in any related markets and your ability to assume the associated risks, if you are at all unsure. We are not under any obligation to update any such material. Any opinion made may be personal to the author and may not reflect the opinion of StoneX Europe Ltd.