


China's steel slump leaves iron ore bulls under the pump
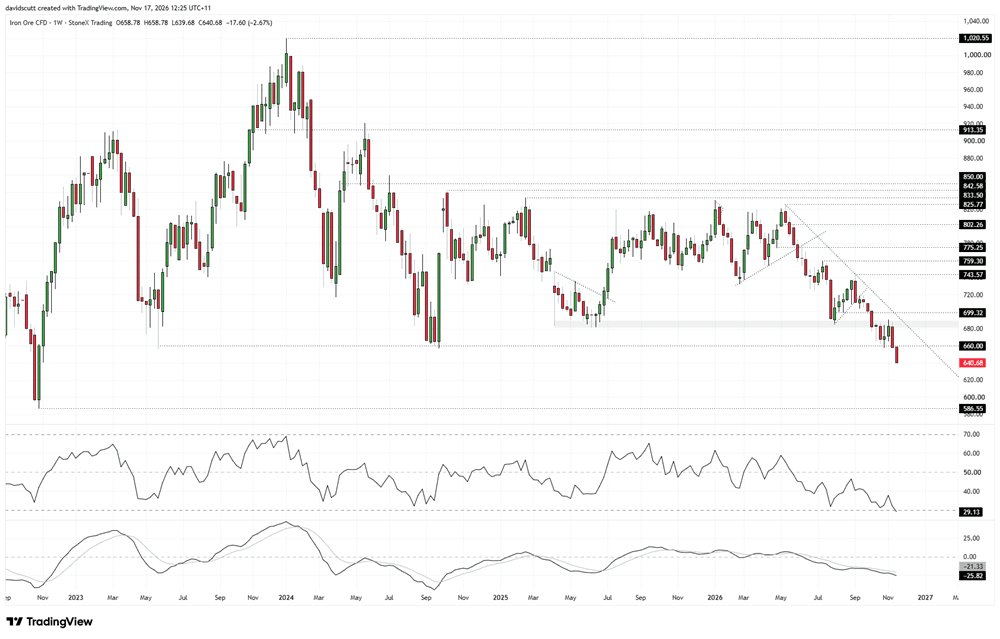
Iron ore has broken major support, threatening a return to the lows of 2022 as mounting evidence of weakness in China's steel sector reinforces the bearish outlook.
Share this:
- Iron ore breaks ¥660 support, exposing 2022 lows
- China October property investment plunges 34.2% YoY
- Just 11.26% of Chinese steelmakers remain profitable
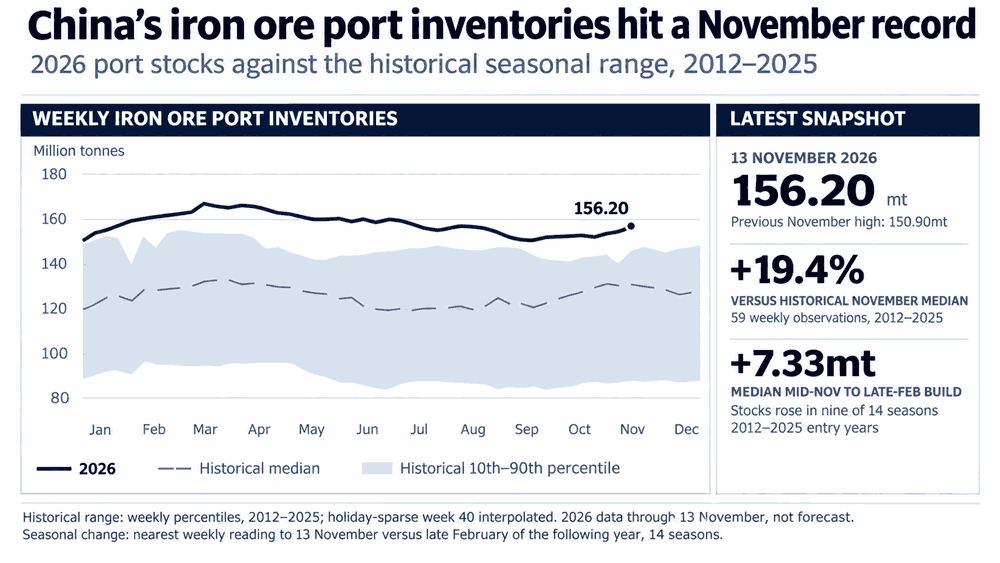
- Iron ore inventories hit record November levels
Iron ore looks horrible on the charts, staging a violent breakdown through key support early this week that has taken the price to fresh multi-year lows. And it's not just technicals explaining the bearish price action, with fundamental factors stacking up in favour of the bears.
China's prolonged property downturn is showing no signs of turning, steel mill profitability has collapsed, and iron ore port inventories in China have never been higher for the month of November. Throw in short-term factors such as environmental restrictions curtailing steel production in parts of China, and it makes for bleak reading for the bulls.
With the price already through key support, the question now is whether to chase the breakdown or wait for a more attractive entry level to improve risk-reward.
China's property slump shows no signs of easing
Rather than relying on China's usual year-to-date, year-on-year property figures, we've backed out the October-only numbers from the cumulative data released yesterday and compared them with the same month a year earlier.
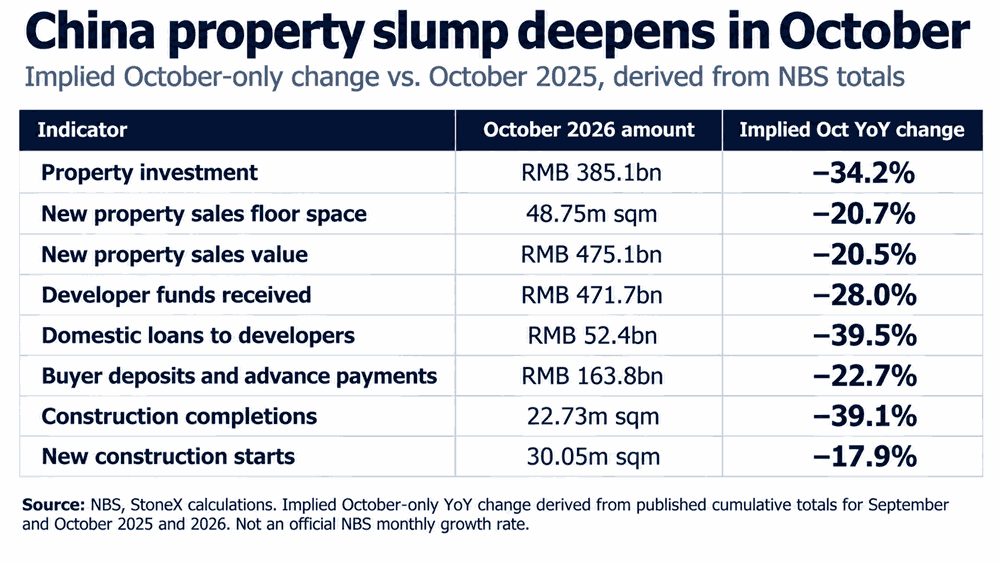
Source: NBS
The results speak for themselves. Property investment alone plunged 34.2% year-on-year. As the graphic below shows, there is simply no sign of China's residential property downturn easing.
That matters for iron ore. At its peak in 2019, residential construction alone accounted for nearly a third of China's steel consumption, in a country responsible for roughly half of global steel demand.
China's steel inventories diverge sharply
Analysis of SteelHome data dating back nearly 15 years reveals a significant divergence between inventories of construction-related steel products and those more closely associated with the manufacturing sector.
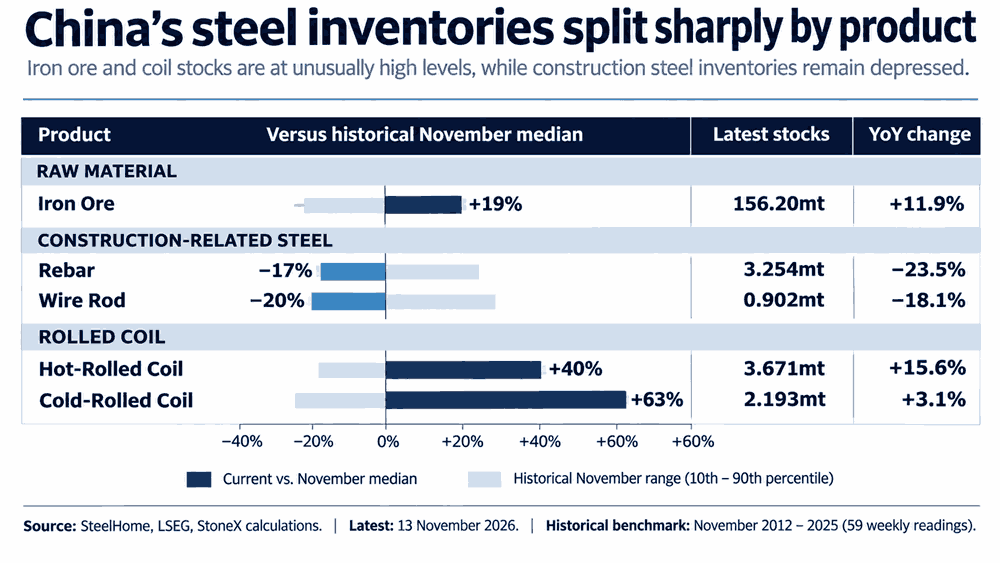
Source: LSEG
As of mid-November, inventories of rebar and wire rod were sitting 17% and 20% below their respective historical November medians. Yet the picture is almost the complete opposite for flat steel products, with hot-rolled and cold-rolled coil inventories standing 40% and 63% above their seasonal norms.
While the unusually low inventories of construction-related steel products might seem at odds with the prolonged weakness in China's property sector, low inventories don't necessarily reflect strong demand. They can also reflect steelmakers cutting production in response to deteriorating demand and profitability.
China's steel mills are bleeding money
Updated data from Mysteel's survey of 247 Chinese steelmakers reveal just how dramatically profitability has deteriorated. In May this year, around two-thirds of mills were operating profitably. Fast forward to late September and that figure had collapsed to just 6.93%, with the latest reading in mid-November showing only a marginal improvement to 11.26%.
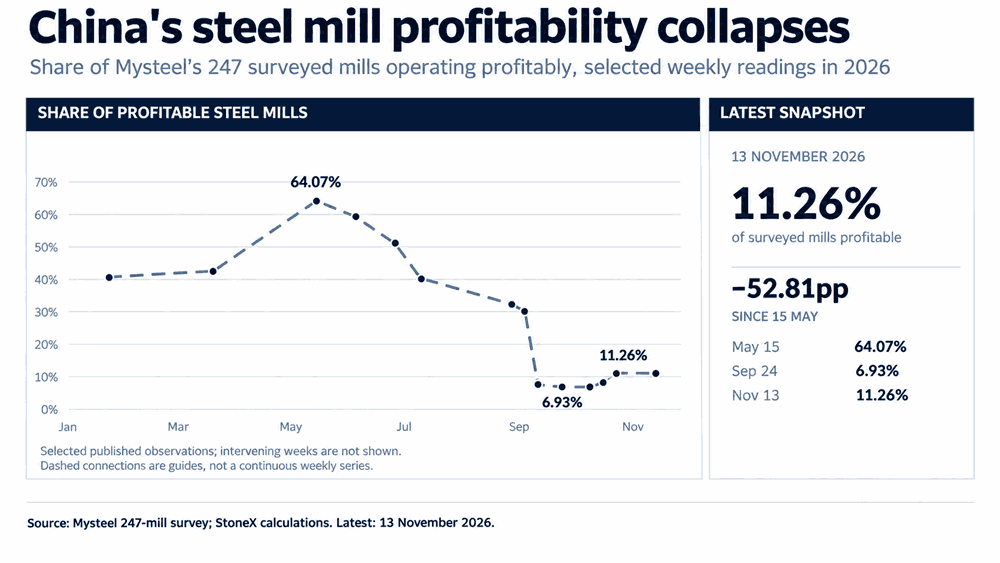
Source: Mysteel
With margins under severe pressure, it's understandable why mills have little incentive to ramp up production and increase demand for raw inputs such as iron ore. Environmental restrictions currently in force in parts of northern China are adding a double whammy of downside pressure, with daily hot metal production falling 2.8% from a year earlier to around 2.30 million tonnes.
[Insert graphic: China's steel mill profitability collapses]
Iron ore inventories hit record November levels
Adding to the already bearish fundamental picture, data from SteelHome reveal iron ore inventories across China's 46 major ports hit a record November high last week, reaching 156.2 million tonnes. That put stockpiles 19.4% above their historical November median.
Source: LSEG
From a seasonal perspective, over the previous 14 years, inventories have risen between mid-November and late February on nine occasions, with a median increase of 7.33 million tonnes.
While that doesn't guarantee we'll see the same this year, it points to potential upside risks for inventories based purely on seasonal patterns. When combined with the other factors discussed above, it goes a long way towards explaining just how bearish the price action in iron ore has been recently.
Chase the breakdown or wait for a bounce?
Since peaking in May, iron ore has been locked in a strong downtrend, printing a relentless series of lower highs and lower lows. The latest break beneath ¥660, a major support level dating back several years, is particularly bearish, opening the door to a potential retest of ¥586.55, the low set in late 2022.
Source: TradingView
With the price now trading around ¥640.68, the question is whether to chase the breakdown towards ¥586.55, implying around 8.4% additional downside, or wait for a potential bounce towards ¥660 and see whether the price gets rejected again. With no evidence of a rebound so far today, the decision largely comes down to individual risk appetite. Initiating shorts around current levels remains an option with a tight stop above ¥660, but my preference would be to wait for a potential backtest and rejection of the latter to improve the risk-reward of the setup.
RSI (14) has set a fresh lower low at 29.13, leaving it only marginally oversold despite the scale of the decline. MACD reinforces the bearish message, having crossed beneath its signal line and continuing to diverge further away in negative territory. Both suggest downside momentum is building rather than fading, favouring short setups over longs.
Of course, if we were to see an abrupt reversal of this breakdown, with the price reclaiming ¥660 on a sustained basis, it would bring the immediate bearish bias into question, particularly given the signal of strength it would send from bulls. If such an outcome were to take place, it may see bulls attempt to spark a more pronounced squeeze towards the former support zone between ¥680 and ¥690, which may now act as resistance. Beyond that, ¥699.32 would be the next level to watch, followed by ¥743.57 and ¥759.30.


The complete CFD trading experience
Award-winning platforms, competitive spreads, low commissions and dedicated support.
We live and breathe the markets and are dedicated to helping traders realise their ambitions as we continue to set the industry bar.
Economic calendar
Web Trader platform
Our sophisticated web-based platform is packed with features.
Related articles
China's steel slump leaves iron ore bulls under the pump
Iron ore has broken major support, threatening a return to the lows of 2022 as mounting evidence of weakness in China's steel sector reinforces the bearish outlook.

NZD/USD Forecast: Kiwi faces historic breakdown as RBNZ survey looms
NZD/USD is teetering above support that held through the pandemic and Liberation Day turmoil. With RBNZ hawks repeatedly disappointed, today's inflation expectations survey could open the door to a slide towards the GFC lows.

USD/JPY, AUD/JPY: Central Bank Divergence Creates Two-Way Risk
USD/JPY eyes a breakout above 160, while AUD/JPY faces further losses as Fed, RBA and BoJ interest rate expectations diverge.

StoneX Europe Ltd may make third party material available on this website which may contain information included but not limited to the conditions of financial markets. The material is for information purposes only and does not contain, and should not be construed as containing, investment advice and/or investment recommendation and/or an investment research and/or an offer of or solicitation for any transactions in financial instruments; any decision to enter into a specific transaction shall be made by the client following an assessment by him/her of their situation.
StoneX Europe Ltd makes no representation or warranty and assumes no liability as to the accuracy or completeness of the information provided, nor any loss arising from any investment based on a recommendation, forecast or other information supplied. You should always seek independent advice as to your suitability to speculate in any related markets and your ability to assume the associated risks, if you are at all unsure. We are not under any obligation to update any such material. Any opinion made may be personal to the author and may not reflect the opinion of StoneX Europe Ltd.