



DXY, GBP/USD, AUD/USD, USD/CAD, USD/JPY, Gold Weekly Technical Outlook
Sr. Technical Strategist Michael Boutros highlights the levels that matter on the USD Majors, commodities, and equity indices charts this week.
Share this:

Weekly Technical Trade Levels on USD Majors, Commodities & Stocks
- Technical trade setups we are tracking into the start of the week on the USD Majors, commodities, and equity indices.
- Register for the next Weekly Strategy Webinar: Monday, November 23, at 8:30 a.m. ET. Follow these setups daily in the Opening Bell, Tuesday-Thursday at 9:30am ET.
- Event risk this week: UK employment, CPI, and retail sales – AU employment – US retail sales & FOMC minutes.
- Review the latest Video Updates or Stream Live on my YouTube playlist
In this webinar we take an in-depth look at the technical trade levels for the US Dollar (DXY), Euro (EUR/USD), British Pound (GBP/USD), Australian Dollar (AUD/USD), Canadian Dollar (USD/CAD), Japanese Yen (USD/JPY), Swiss Franc (USD/CHF), Gold (XAU/USD), Crude Oil (WTI), Bitcoin (BTC/USD), S&P 500 (SPX500), Nasdaq (NDX), and Dow Jones (DJI). These are the levels that matter on the technical charts into the weekly open. The assets are chaptered on the recording for your convenience.
British Pound Price Chart – GBP/USD Weekly
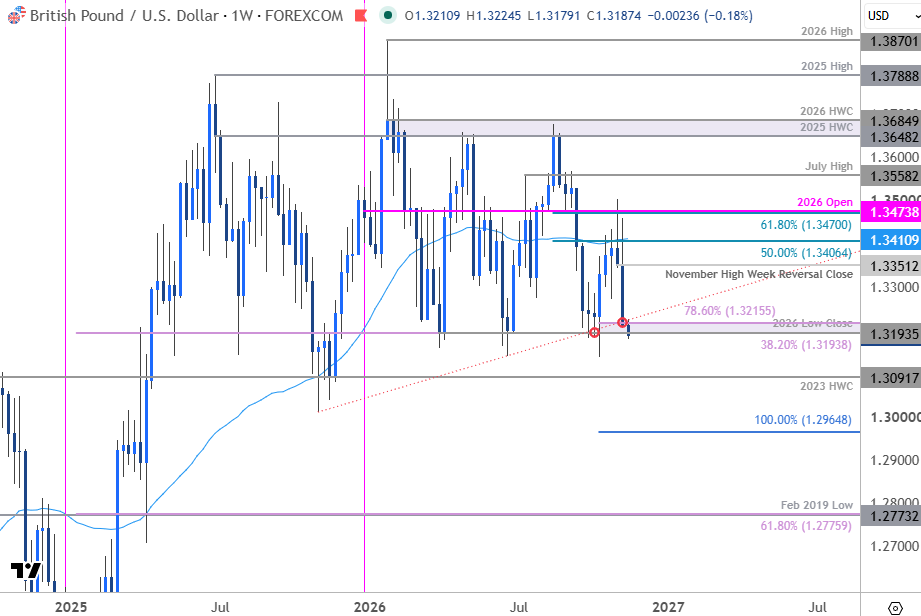
Chart Prepared by Michael Boutros, Sr. Technical Strategist; GBP/USD on TradingView
Notes: Sterling is under pressure at the start of the week with GBP/USD plunging 2.4% off the monthly high and threatening a third consecutive weekly decline. The bears are attempting to break below a major technical support zone at the lower bounds of the yearly range this week at 1.3194-1.3215. This region is defined by the 2026 low-close, the 38.2% retracement of the 2025 advance, and the 78.6% retracement of the October rally. The focus is on possible inflection off this zone with a weekly close below needed to validate the breakout.
Subsequent support objectives rest with the 2023 high-week close (HWC) a 1.3092 and the 100% extension of the August decline at 1.2965. Initial resistance is eyed at the November high-week reversal close at 1.3351 backed by the 50% retracement of the August decline and the 52-week moving average at 1.3406/11. Key resistance is steady at the 61.8% retracement and the 2026 yearly open at 1.3470/74. A breach / weekly close above this threshold would be needed to suggest a more significant low is in place, and a larger recovery is underway.
Bottom line: GBP/USD is testing pivotal support at the close lows of the year. While the near-term outlook remains tilted to the downside, the bears may be vulnerable while above this level. From a trading standpoint, rallies would need to be limited to 1.3351 IF Sterling is heading lower on this stretch with a weekly close below 1.3194 needed to fuel the next major leg of the decline.

Australian Dollar Price Chart – AUD/USD Weekly
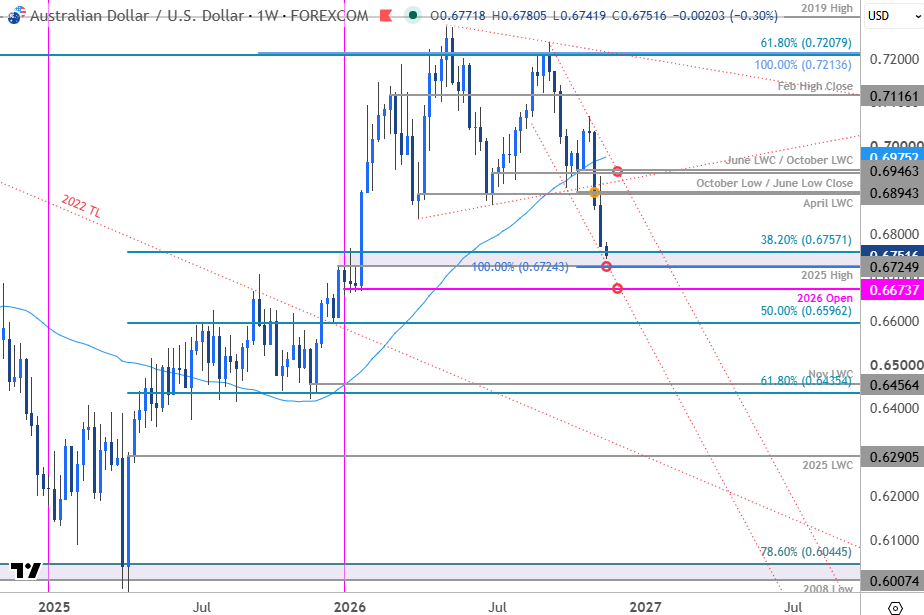
Chart Prepared by Michael Boutros, Sr. Technical Strategist; AUD/USD on TradingView
Notes: Aussie has plunged more than 6.8% from the September high with price breaking below a multi-month consolidation pattern into the open of November. The decline is now testing pivotal support at 6725/57- a region defined by the 100% extension of the September selloff, the 2025 swing high, and the 38.2% retracement of the 2025 advance. Note that basic parallel support converges on this threshold this week and the immediate focus is on a possible price inflection here.
Weekly resistance remains unchanged at 6890/94 where the April low-week close (LWC) converges on the October low and the June low close. Broader bearish invalidation is eyed at the June & October LWCs at 6938/46. A break below this key zone exposes subsequent support objectives at the 2026 yearly open at 6674 and the 50% retracement at 6596.
Bottom line: AUD/USD is testing a major pivot zone here and while the near-term outlook remains weighted to the downside, the bears will need to mark a weekly close below this threshold to keep the downtrend viable into the close of the month. From a trading standpoint, rallies should be limited to the March low at 6833 IF price is heading lower on this stretch with a close below 6724 needed to fuel the next leg lower in price.

Canadian Dollar Price Chart – USD/CAD Daily
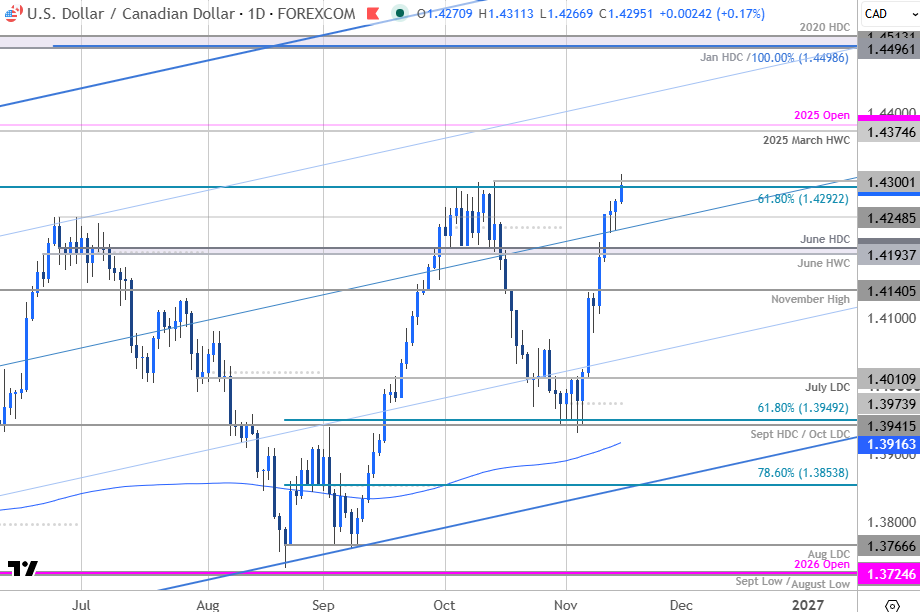
Chart Prepared by Michael Boutros, Sr. Technical Strategist; USD/CAD on TradingView
Notes: USD/CAD has extended into key resistance today with the bulls attempting to mark a fifth consecutive daily advance. The rally is testing the 61.8% retracement of the 2025 decline and the October / yearly high at 1.4292-1.43. The immediate focus is on this zone with a daily close above needed to keep the long-bias viable in the days ahead. Note that daily RSI is now testing the 70-threshold and a close above this level alongside a breach above 1.43 would likely fuel the next major leg of this advance.
The next major technical considerations are eyed at the 2025 March high-week close (HWC) and the 2025 yearly open at 1.4375/83. Subsequent resistance objectives are eyed at the 75% parallel of the yearly pitchfork (currently near 1.4420s) and 1.4496-1.4513- a region defined by the 100% extension of the January rally, the 2025 January high-day close (HDC), and the 2020 HDC.
Look for initial support at the June high at 1.4248 with key support / near-term bullish invalidation now raised to the June high-day / high-week closes (HDC/HWC) at 1.4194-1.4202. Ultimately, losses below the 2025 November high at 1.4140 would be needed to suggest a more significant high is in place, and a larger reversal is underway.
Bottom Line: USD/CAD is testing major resistance into the start of the week, and the focus is whether price can close above this area. From a trading standpoint, losses should be limited to 1.4194 IF price is heading higher on this stretch with a close above 1.43 needed to mark resumption of the monthly uptrend.
Economic Calendar – Key Data Releases
Economic Calendar - latest economic developments and upcoming event risk.
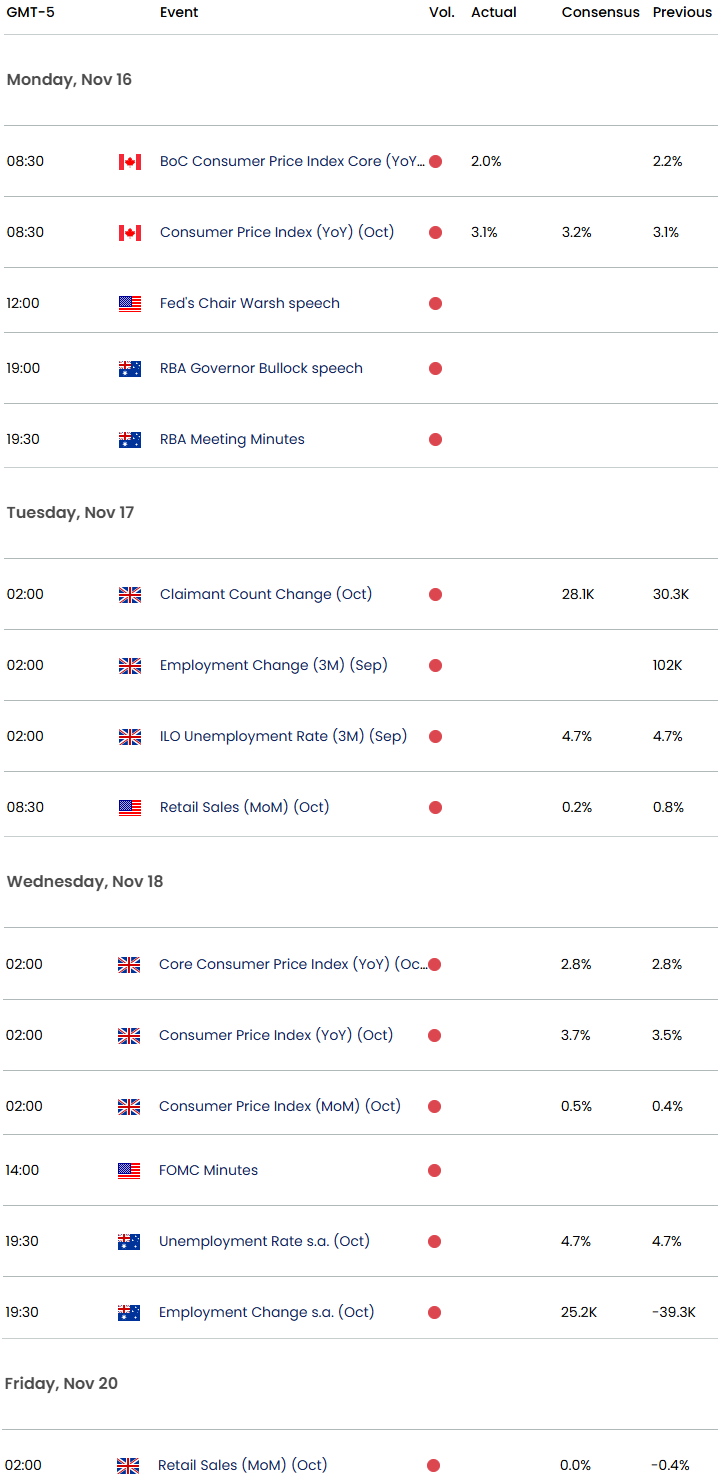
USD Majors event risk is elevated this week, beginning with today’s Canadian CPI, which held at 3.1% year over year and rose 0.2% month over month. U.K. labor-market data and the RBA minutes are due Tuesday, followed by U.S. retail sales and industrial production. Wednesday brings U.K. CPI, Australian wage data, euro-area inflation, and the FOMC minutes, while Thursday features Australia’s employment report, U.S. jobless claims, and Japan’s CPI. Friday’s U.K. retail sales and U.S. Michigan Consumer Sentiment close out the calendar, with the key market focus on whether the data reinforce or challenge the dollar’s higher-rate outlook.
--- Written by Michael Boutros, Senior Technical Strategist
Follow Michael on X @MBForex


The complete CFD trading experience
Award-winning platforms, competitive spreads, low commissions and dedicated support.
We live and breathe the markets and are dedicated to helping traders realise their ambitions as we continue to set the industry bar.
Economic calendar
Web Trader platform
Our sophisticated web-based platform is packed with features.
Related articles
China's steel slump leaves iron ore bulls under the pump
Iron ore has broken major support, threatening a return to the lows of 2022 as mounting evidence of weakness in China's steel sector reinforces the bearish outlook.

NZD/USD Forecast: Kiwi faces historic breakdown as RBNZ survey looms
NZD/USD is teetering above support that held through the pandemic and Liberation Day turmoil. With RBNZ hawks repeatedly disappointed, today's inflation expectations survey could open the door to a slide towards the GFC lows.

USD/JPY, AUD/JPY: Central Bank Divergence Creates Two-Way Risk
USD/JPY eyes a breakout above 160, while AUD/JPY faces further losses as Fed, RBA and BoJ interest rate expectations diverge.

StoneX Europe Ltd may make third party material available on this website which may contain information included but not limited to the conditions of financial markets. The material is for information purposes only and does not contain, and should not be construed as containing, investment advice and/or investment recommendation and/or an investment research and/or an offer of or solicitation for any transactions in financial instruments; any decision to enter into a specific transaction shall be made by the client following an assessment by him/her of their situation.
StoneX Europe Ltd makes no representation or warranty and assumes no liability as to the accuracy or completeness of the information provided, nor any loss arising from any investment based on a recommendation, forecast or other information supplied. You should always seek independent advice as to your suitability to speculate in any related markets and your ability to assume the associated risks, if you are at all unsure. We are not under any obligation to update any such material. Any opinion made may be personal to the author and may not reflect the opinion of StoneX Europe Ltd.