


S&P 500, Nasdaq, Dow Forecast: Nasdaq Selloff Deepens as Dow Rally Stalls
A failed S&P breakout and looming Nasdaq support test raise the stakes for next week’s Fed decision and October’s monthly close.
Share this:

Equity Indices Technical Forecast: Weekly Trade Levels
- U.S. equities closed mix this week, with the S&P 500 slipping nearly 0.4%, the Nasdaq down more than 0.7% and Dow rallying 0.5%.
- S&P 500: A failed breakout to fresh record highs has triggered a nearly 3% reversal, with the two-week decline now approaching critical weekly support. A break lower would increase the risk of a larger correction.
- Nasdaq 100: The technology-heavy index has retreated more than 8% from its record high, breaking below key pitchfork support as sellers target the next major support zone. Downside risks remain elevated while below former support.
- Dow Jones: A three-week recovery has extended more than 4.7% from the September lows, but the advance has stalled at confluent resistance. A weekly close above this barrier is needed to strengthen the case for a more significant bullish reversal.
- Event Risk: Next week’s Fed rate decision, U.S. GDP and PCE inflation data, and major technology earnings could fuel volatility into month-end, with Treasury yields and the Fed’s policy outlook in focus.
The recent retreat from record highs has left U.S. equities increasingly vulnerable heading into the final week of October. While the broader uptrends remain intact, mounting selling pressure has shifted the focus toward key technical levels that could determine whether the latest pullback develops into a more significant correction. The stakes are especially high with next week’s Federal Reserve decision, U.S. inflation data and a wave of major technology earnings threatening to drive renewed volatility in Treasury yields and equity markets. With month-end fast approaching, the reaction into these critical thresholds could offer important guidance for the November outlook.
S&P 500 Price Chart – SPX500 Weekly
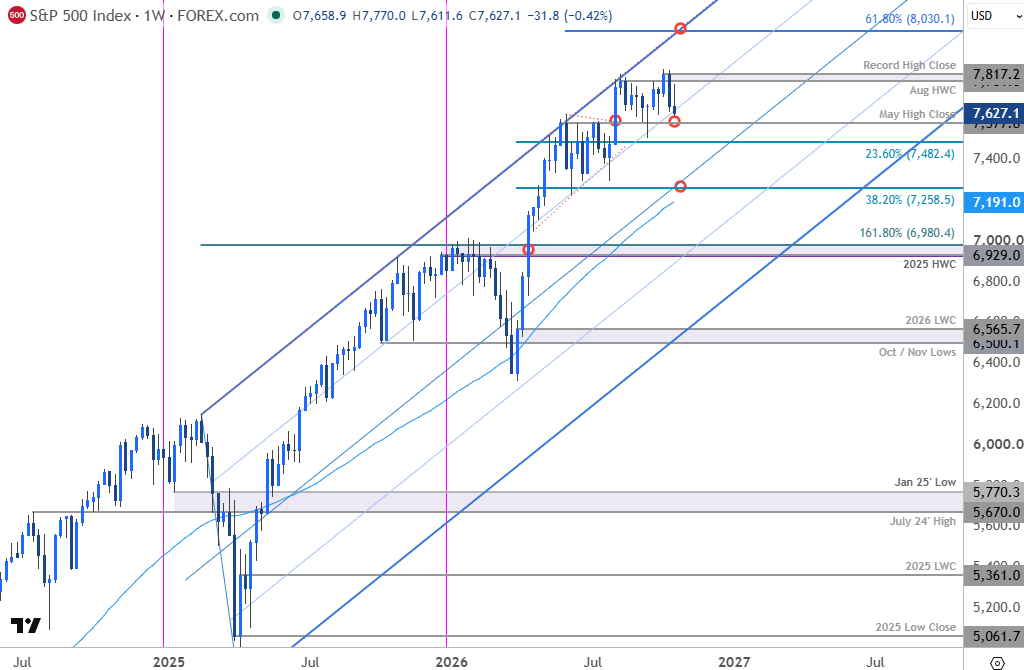
Chart Prepared by Michael Boutros, Sr. Technical Strategist; S&P 500 on TradingView
Technical Outlook: In last month’s S&P 500 Forecast we noted that the SPX500 was, “trading into pivotal resistance near the record high close, and the outlook remains unchanged into the close of the month. From a trading standpoint, losses would need to be limited to 7461 IF the index is heading higher on this stretch with a close above 7781 needed to fuel the next major leg of the rally.” The index broke higher two-weeks later and despite registering a fresh record high at 7,844, the bulls were unable to sustain the breakout. Bearish momentum divergence has given way with the subsequent reversal now extending nearly 3% off the highs.
The index is now attempting to break below the 75% parallel of the 2025 pitchfork with weekly support seen just lower at the May high close near 7578 and the 23.6% retracement of the yearly range at 7483. A break / weekly close below this threshold would suggest a more significant high is in place, and a larger correction is underway with the next major technical consideration eyed at the 52-week moving average and the 38.2% retracement at 7191-7258.
Key resistance is now eyed at the August high week close (HWC) and the record high close at 7782-7812. A breach / weekly close above this region is needed to mark uptrend resumption and fuel the next major leg of the advance towards the 61.8% extension of the March rally near 8030- look for a larger reaction there IF reached.
Bottom line: A two-week decline in the S&P 500 is now approaching initial weekly support and raises the stakes for next week’s Fed decision and subsequent inflation report. From a trading standpoint, the focus is on a breakout of the October range for directional guidance into the close of the month- losses would need to be limited to 7482 to avert a larger correction within the broader uptrend.

Nasdaq Price Chart – NDX Weekly
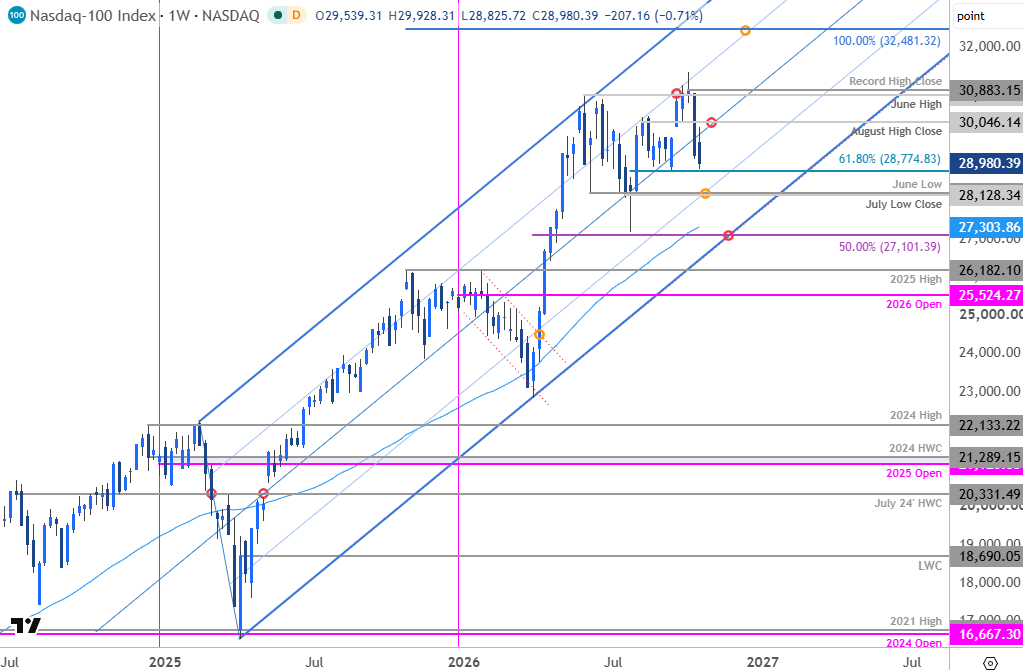
Chart Prepared by Michael Boutros, Sr. Technical Strategist; NDX on TradingView
Technical Outlook: Nasdaq was the worst performer last week with the index slipping more than 0.7% to extend a decline of more than 8% off the record high. A reversal off the 75% parallel of the 2025 pitchfork early in the month has now broken below the median line. The bears are now within striking distance of support at the 61.8% retracement of the July advance and the September low at 28,753/75. Key support rests just lower at the July low close and the June low at 28,128/97. Note that the 25% parallel converges on this region over the next few weeks and losses below this slope would be needed to suggest a more significant high is in place, and a larger reversal is underway toward the 50% retracement of the yearly range at 27,101.
Initial resistance is eyed at the August high close at 30,046 which converges on the median line into the close of the month. A breach / weekly close above this level would be needed to invalidate the October downtrend with key resistance steady at the June high and the record high close at 30,762/883. Strength surpassing this region would mark resumption of the broader uptrend toward the record highs at 31,361 and the 100% extension of the 2025 rally at 32,481.
Bottom line: A two-week selloff is now approaching support with weekly momentum extending to the lowest levels since April. The risk remains for further losses here while below the median line. From a trading standpoint, rallies would need to be limited to 30,046 IF the index is heading for a deeper pullback on this stretch with a close below 28,775 needed to fuel the next leg lower in price. Look for a larger reaction near the June lows IF reached.
Dow Jones Price Chart – DJI Weekly
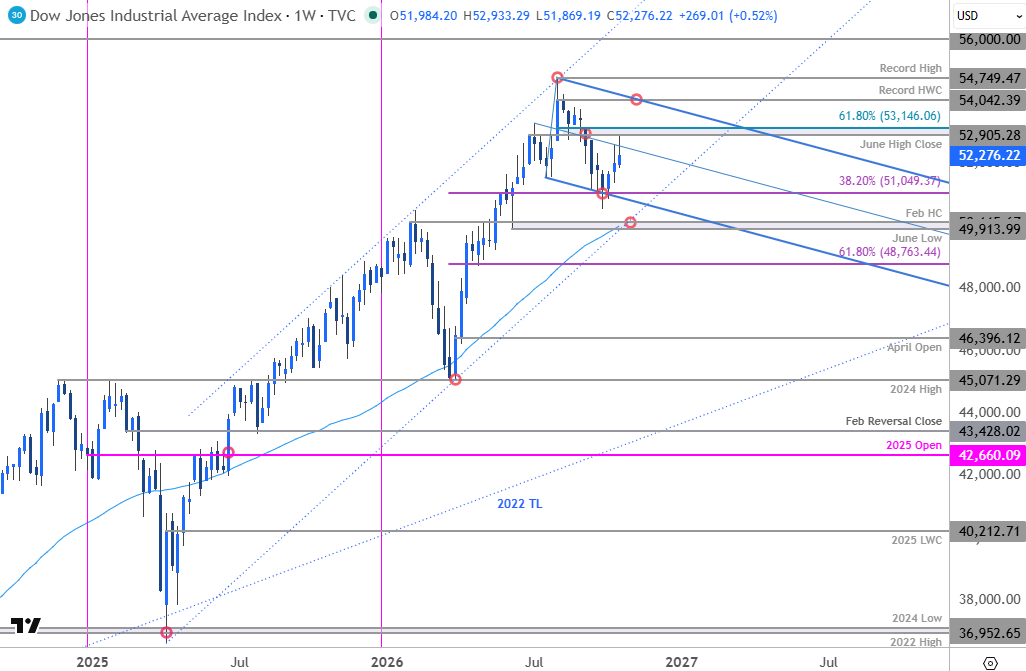
Chart Prepared by Michael Boutros, Sr. Technical Strategist; DJI on TradingView
Technical Outlook: The Dow was the best performer last week with the index posting a third consecutive weekly advance after rebounding off support in early October. The rally extended more than 4.7% off the September lows before exhausting into confluent resistance on Thursday at 52,905-53,146. This region is defined by the June high close and the 61.8% retracement of the August decline. A breach / weekly close above this threshold is needed to suggest a more significant low is in place with key resistance eyed at the record high week close (HWC) at 54,042. Note that the upper parallel of the August downtrend converges on this threshold in early November and strength surpassing this slope would be needed to mark resumption of the broader uptrend. Subsequent resistance is eyed at the record high at 54,750 and 56,000.
Weekly support rests at the 38.2% retracement of the yearly range at 51,049 with broader bullish invalidation steady at 49,913-50,115. This region is defined by the June low, the 52-week moving average, and the February high close, and converges on the 2025 channel line over the next few weeks. A break / weekly close below this threshold would be needed to invalidate the multi-year uptrend and threaten a larger trend reversal. Subsequent support rests with the 61.8% retracement at 48,763.
Bottom line: The Dow rebounded off confluent support early in the month with the recovery now testing the first major resistance hurdle. From a trading standpoint, losses would need to be limited to 51,049 IF price is heading higher on this stretch with a breach / weekly close above 53,146 needed to fuel the next leg of the advance.
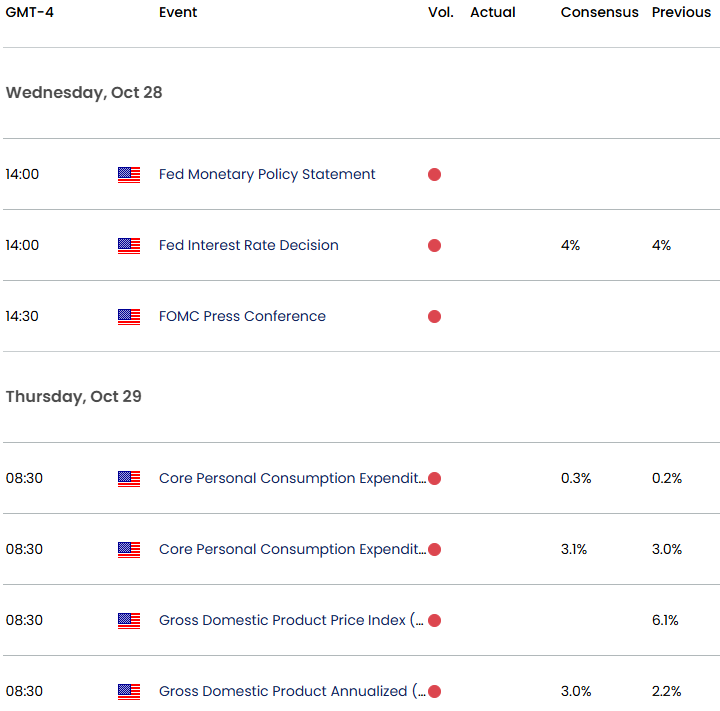
Event risk intensifies next week with the Federal Reserve’s October 27–28 meeting, followed by U.S. GDP and PCE inflation data on Thursday. A widely expected hold may keep the initial rate reaction contained, but any shift in the Fed’s guidance—or a hotter inflation signal—could quickly lift Treasury yields and pressure the Nasdaq in particular. The S&P 500 and Dow will also contend with a heavy earnings slate, including Alphabet and Microsoft on Wednesday and Amazon and Intel on Thursday, with investors already questioning whether elevated AI spending can generate adequate returns. Rising oil prices and ongoing geopolitical risk add another layer of volatility, while month-end positioning could exaggerate moves into Friday’s close. Stay nimble into the releases and watch the weekly / monthly closes for guidance.
Key US Economic Data Releases
Active Weekly Technical Charts
- Australian Dollar (AUD/USD)
- British Pound (GBP/USD)
- Euro (EUR/USD)
- Swiss Franc (USD/CHF)
- Gold (XAU/USD)
- US Dollar Index (DXY)
- Canadian Dollar (USD/CAD)
- Japanese Yen (USD/JPY)
- Bitcoin (BTC/USD)
--- Written by Michael Boutros, Senior Technical Strategist
Follow Michael on X @MBForex



The complete CFD trading experience
Award-winning platforms, competitive spreads, low commissions and dedicated support.
We live and breathe the markets and are dedicated to helping traders realise their ambitions as we continue to set the industry bar.
Economic calendar
Web Trader platform
Our sophisticated web-based platform is packed with features.
Related articles
S&P 500, Nasdaq, Dow Forecast: Nasdaq Selloff Deepens as Dow Rally Stalls 10 24 2026
A failed S&P breakout and looming Nasdaq support test raise the stakes for next week’s Fed decision and October’s monthly close.

USD/JPY Weekly Outlook: AI earnings could overshadow the Fed and BoJ
AI sentiment has become a major driver of US Treasury yields and USD/JPY. With Microsoft, Alphabet and Amazon reporting this week, central bank decisions may have competition for traders' attention.


Australian Dollar Forecast: AUD/USD Support Reversal Sparks Monthly Range Breakout 10 23 2026
A sharp reversal off key support has fueled the AUD/USD recovery, with resistance now in focus ahead of next week’s Fed decision and Australian CPI.
StoneX Europe Ltd may make third party material available on this website which may contain information included but not limited to the conditions of financial markets. The material is for information purposes only and does not contain, and should not be construed as containing, investment advice and/or investment recommendation and/or an investment research and/or an offer of or solicitation for any transactions in financial instruments; any decision to enter into a specific transaction shall be made by the client following an assessment by him/her of their situation.
StoneX Europe Ltd makes no representation or warranty and assumes no liability as to the accuracy or completeness of the information provided, nor any loss arising from any investment based on a recommendation, forecast or other information supplied. You should always seek independent advice as to your suitability to speculate in any related markets and your ability to assume the associated risks, if you are at all unsure. We are not under any obligation to update any such material. Any opinion made may be personal to the author and may not reflect the opinion of StoneX Europe Ltd.