



Canadian Dollar Short-term Outlook: USD/CAD Plunge Stalls at Pivotal Support—Range Break in Focus
Friday’s U.S. and Canadian employment reports could trigger a decisive USD/CAD move as bulls and bears battle for control at critical support.
Share this:

Canadian Dollar Technical Outlook: USD/CAD Short-term Trade Levels
- USD/CAD has declined nearly 2.6% from the yearly high after breaking below the October opening range, reversing much of the September advance.
- The selloff has stalled at major technical support, with a well-defined weekly range developing just above this critical threshold.
- A break below support would threaten resumption of the October downtrend while bulls need to reclaim near-term resistance to strengthen the case for an exhaustion low.
- Friday's simultaneous U.S. and Canadian employment reports could provide the catalyst for the next major directional move.
- Resistance 1.4011, 1.4071 (key), 1.4140- Support 1.3942/49 (key), ~1.3896, 1.3854
The Canadian Dollar has strengthened considerably in recent weeks, driving USD/CAD toward a major technical inflection zone as the November opening range takes shape. The latest decline has found buyers at a critical support confluence, but the subsequent consolidation has done little to resolve the broader directional outlook. The immediate focus is on whether bulls can establish a more significant low or sellers regain control and extend the correction. The stakes are particularly high heading into Friday's simultaneous U.S. and Canadian employment releases, with the results likely to influence Fed and BoC rate expectations and fuel volatility into the weekly close. Battle lines drawn on the USD/CAD short-term technical charts.
Review my latest Weekly Strategy Webinar for an in-depth breakdown of this USD/CAD technical setup and more. Join me live Mondays at 8:30am EST and tune in to the Opening Bell Tuesday through Friday at 9:30am EST for continued market coverage throughout the week. All episodes are archived on my YouTube Playlist.
Canadian Dollar Price Chart – USD/CAD Daily
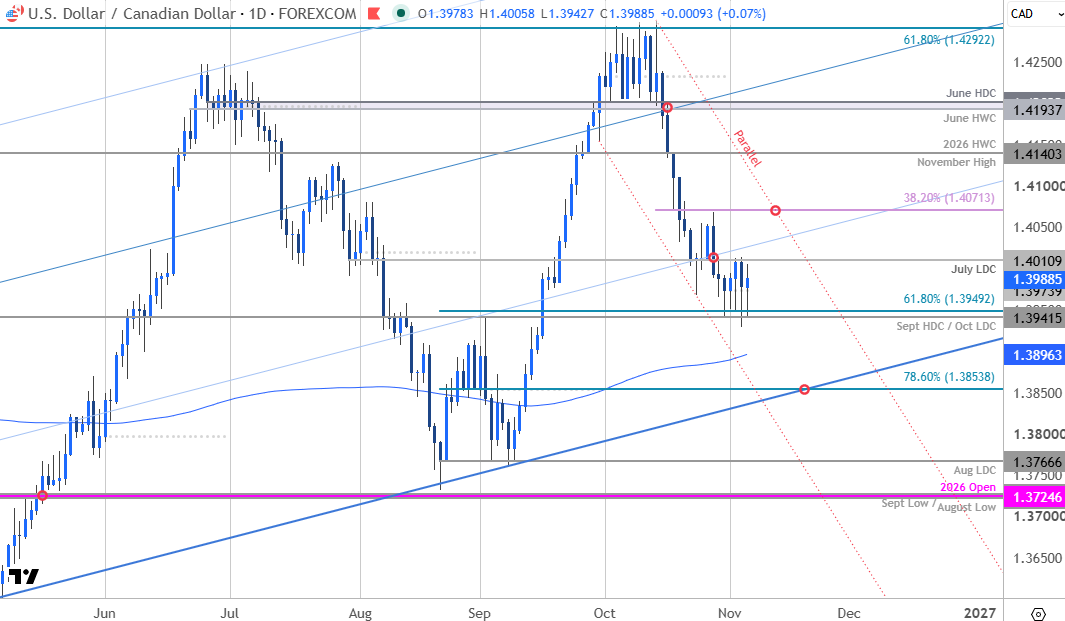
Chart Prepared by Michael Boutros, Sr. Technical Strategist; USD/CAD on TradingView
Technical Outlook: In last month’s Canadian Dollar Short-term Outlook, we noted that USD/CAD was, “trading within a well-defined monthly range just below key resistance. Bearish momentum divergence on the daily chart warns that the rally may be vulnerable here despite today’s push post-CPI. From a trading standpoint, the focus remains on a breakout of this key zone.” The range broke to the downside four days later with the subsequent decline extending nearly 2.6% off the October / yearly high.
The selloff was halted last week at a major support pivot at 1.3942/49- a region defined by the 2025 September high-day close (HDC) & October low-day close (LDC) and the 61.8% retracement of the August rally. The weekly / monthly opening range is preserved just above this level, and the focus is on breakout of this range with major event risk on tap into the close of the week.
Canadian Dollar Price Chart – USD/CAD 240min
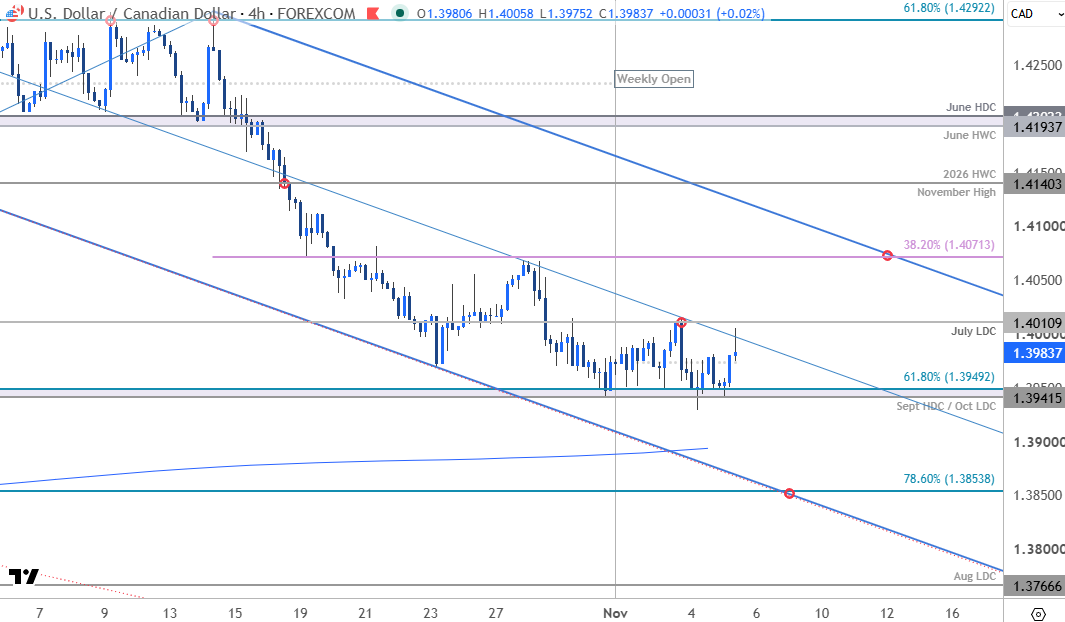
Chart Prepared by Michael Boutros, Sr. Technical Strategist; USD/CAD on TradingView
Notes: A closer look at USD/CAD price action Loonie trading within the confines of a proposed descending pitchfork extending off the October high with the weekly range intact just below the median line. Initial resistance is eyed at the July high-day close (HDC) at 1.4011 and is backed by 38.2% retracement of the decline off the yearly high at 1.4071. This level converges on the upper parallel next week. A breach / daily close above this slope would ultimately be needed to suggest a more significant low is in place, and a larger reversal is underway. Subsequent resistance objectives eyed at the November high / 2026 high-week close (HWC) at 1.4140 and the June HWC/HDC at 1.4193-1.4202.
A break below this key pivot zone would threaten resumption of the October downtrend towards the 200-day moving average (currently ~1.3896) and the 78.6% retracement at 1.3854. Note that this level converges on the lower parallel early next week- look for a larger reaction there IF reached. The next technical consideration rests with the August low-day close (LDC) at 1.3767.

Bottom line: USD/CAD is trading within a well-defined weekly range (1.3942-1.4011) just above key support. The immediate focus is on a breakout to fuel the next directional move with October downtrend vulnerable while above this key pivot zone. From a trading standpoint, rallies would need to be limited to 1.4071 IF price is heading lower on this stretch with a close below 1.3942 needed to fuel the next leg of the decline.
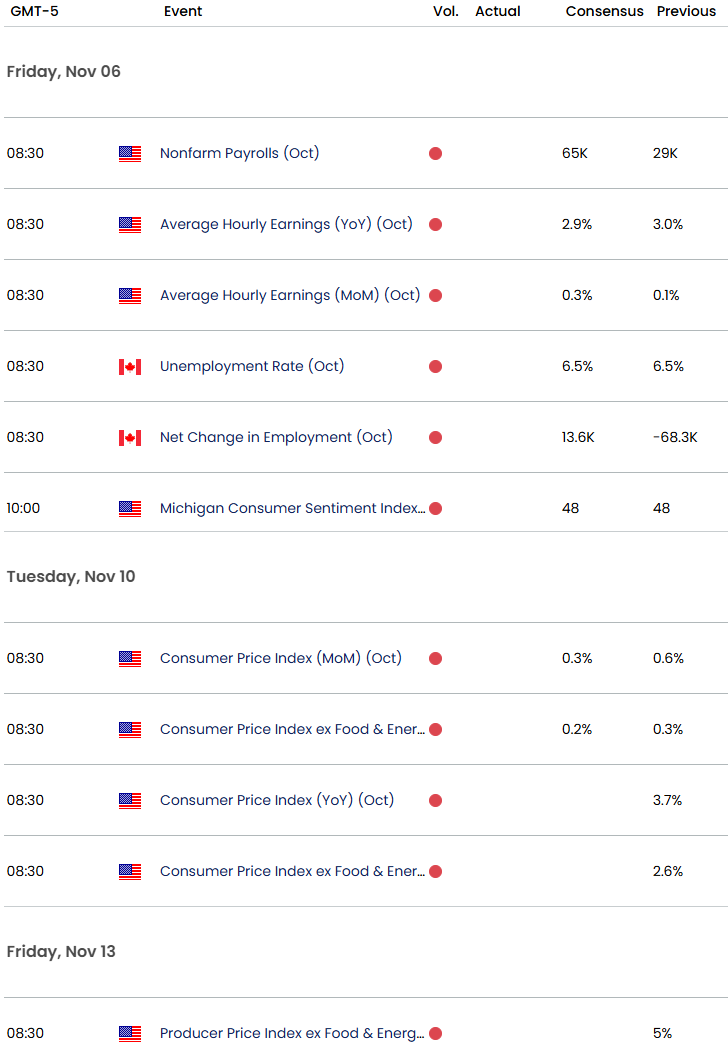
USD/CAD event risk into the close of the week is centered on Friday’s simultaneous U.S. and Canadian employment reports. The data will offer the next major read on the policy outlook after the Fed held rates last week and the Bank of Canada delivered a hike. With markets still pricing roughly an 80% chance of another Fed hike in December, a stronger U.S. payrolls report relative to Canada could help support USD/CAD. A stronger Canadian release, particularly after September’s sharp employment decline, would reinforce downside pressure on the pair. Stay nimble into the releases and watch the weekly close for guidance. Review my latest Canadian Dollar Weekly Forecast for a closer look at the longer-term USD/CAD technical trade levels.
Key USD/CAD Economic Data Releases
Economic Calendar - latest economic developments and upcoming event risk.
Active Short-term Technical Charts
- Swiss Franc Short-term Outlook: USD/CHF Selloff Nears Critical Support Ahead of NFP
- US Dollar Short-term Outlook: USD Rally on the Line as Midterms, NFP Loom
- British Pound Short-term Outlook: GBP/USD Breakout Rally Tests Major Resistance
- Euro Short-term Outlook: EUR/USD Rebound Faces Critical Test After Trend Break
- Gold Price Short-term Outlook: XAU/USD Holds Critical Support as Breakout Nears
- Japanese Yen Short-term Outlook: USD/JPY Breakout Risk Builds Below 200-Day Average
- Australian Dollar Short-term Outlook: AUD/USD Rebound Challenges September Downtrend
Written by Michael Boutros, Senior Technical Strategist
Follow Michael on X @MBForex
Latest market news




The complete CFD trading experience
Award-winning platforms, competitive spreads, low commissions and dedicated support.
We live and breathe the markets and are dedicated to helping traders realise their ambitions as we continue to set the industry bar.
Economic calendar
Web Trader platform
Our sophisticated web-based platform is packed with features.
Related articles
Canadian Dollar Short-term Outlook: USD/CAD Plunge Stalls at Pivotal Support—Range Break in Focus 11 5 2026
Friday’s U.S. and Canadian employment reports could trigger a decisive USD/CAD move as bulls and bears battle for control at critical support.
GBP/USD Forecast: BoE Caution Leaves the Pound Searching for Direction
Although GBP/USD has gained close to 0.5% over the last three trading sessions, reflecting a period of relative strength for the British pound, today's session has started to show a more neutral tone and the bullish momentum seen earlier in the week has begun to slow.
NFP Preview: New Government, Same Jobs Market?
Traders are still sifting through the fallout of the US midterm elections, just in time to get hit with another volatility: The monthly Non-Farm Payrolls (NFP) report - what will the jobs report show, and what could it mean for the US dollar?

StoneX Europe Ltd may make third party material available on this website which may contain information included but not limited to the conditions of financial markets. The material is for information purposes only and does not contain, and should not be construed as containing, investment advice and/or investment recommendation and/or an investment research and/or an offer of or solicitation for any transactions in financial instruments; any decision to enter into a specific transaction shall be made by the client following an assessment by him/her of their situation.
StoneX Europe Ltd makes no representation or warranty and assumes no liability as to the accuracy or completeness of the information provided, nor any loss arising from any investment based on a recommendation, forecast or other information supplied. You should always seek independent advice as to your suitability to speculate in any related markets and your ability to assume the associated risks, if you are at all unsure. We are not under any obligation to update any such material. Any opinion made may be personal to the author and may not reflect the opinion of StoneX Europe Ltd.