



Bitcoin, S&P 500 Outlook: Wall Street Volatility Rattles BTC
Wall Street’s sharp swings are shaking crypto markets, with the S&P 500 and Bitcoin both flashing signs of weakness after recent highs.
Share this:

Wall Street’s surge in volatility is reverberating through crypto markets, leaving Bitcoin bulls on edge. The S&P 500 endured its most turbulent session since April, while Bitcoin hovered near key support around 108 k. With correlations between Bitcoin, equities, and tech stocks strengthening, traders should watch for clues from Wall Street’s next move. A breakdown in equities could easily tip Bitcoin into a deeper correction.
View related analysis:
View related analysis:
Wall Street Volatility Threatens Bitcoin’s Uptrend
Bitcoin (BTC/USD) Futures Technical Analysis: Bitcoin vs US Dollar
The weekly chart shows that bitcoin bulls have enjoyed a strong rally from the November 2022 low to the August 2025 high. Yet the trend has paused for breath, with prices effectively ranging between 109k and 125k. The question now, of course, is whether we’ll see dip buyers emerge and send bitcoin to fresh highs, or if we’ve witnessed the early stages of a deeper pullback. To answer that, we should look at the relationship between bitcoin and Wall Street, alongside price action clues.
The size of the retracement so far is relatively shallow at just -14%, given the retracement from March to August 2024 was -32.5%, and the one seen in April was of similar size. But we have also seen three reversal candles form around my original bull-flag target, while trading volumes have steadily trended lower.
Bulls are likely to seek dips while bitcoin prices remain above the 108,590 low — but a break beneath that key level clearly paves the way for a deeper pullback.
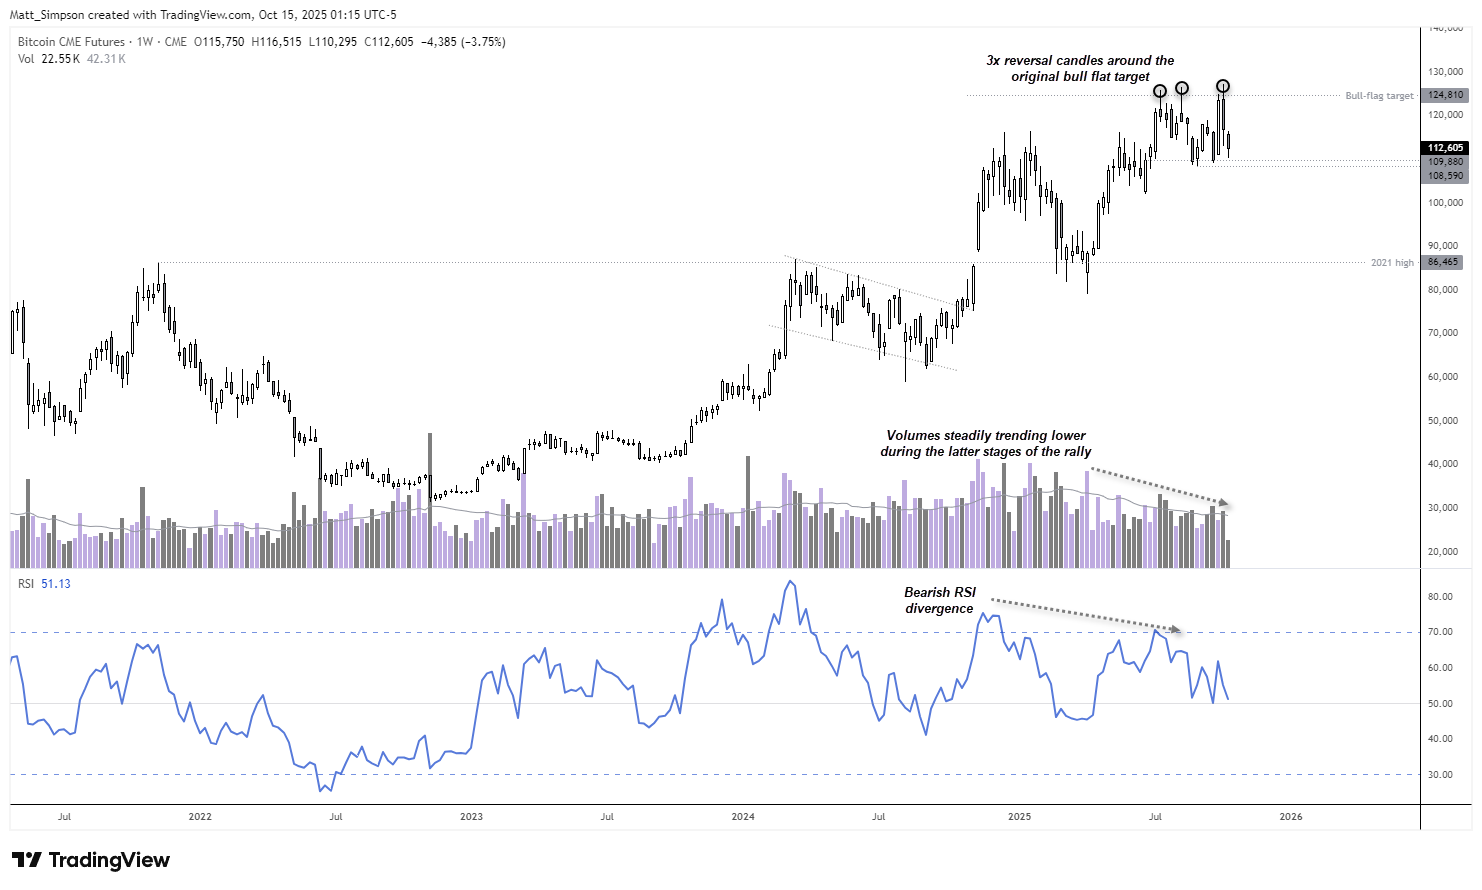
Chart analysis by Matt Simpson - data source: TradingView Bitcoin CME Futures (BTC1!)


Bitcoin (BTC/USD) Technical Analysis: Bitcoin vs US Dollar
Bitcoin has long shared a positive correlation with Wall Street indices, though its strength oscillates over time. Since becoming ‘institutionalised’ before COVID, bitcoin has effectively become another proxy for risk sentiment. I therefore doubt we’ll see the cryptocurrency break to new highs until Wall Street does — unless a sector-specific catalyst emerges.
While correlations are currently strongest between bitcoin, Ethereum, Ripple (XRP), and Solana, these cryptocurrencies typically follow bitcoin’s lead. And with correlations against the Nasdaq 100, S&P 500, and Nvidia’s share price strengthening over the past month, traders should keep a close eye on how these key indices perform. Unfortunately for bitcoin bulls, I suspect we’re witnessing a dead-cat bounce on Wall Street.

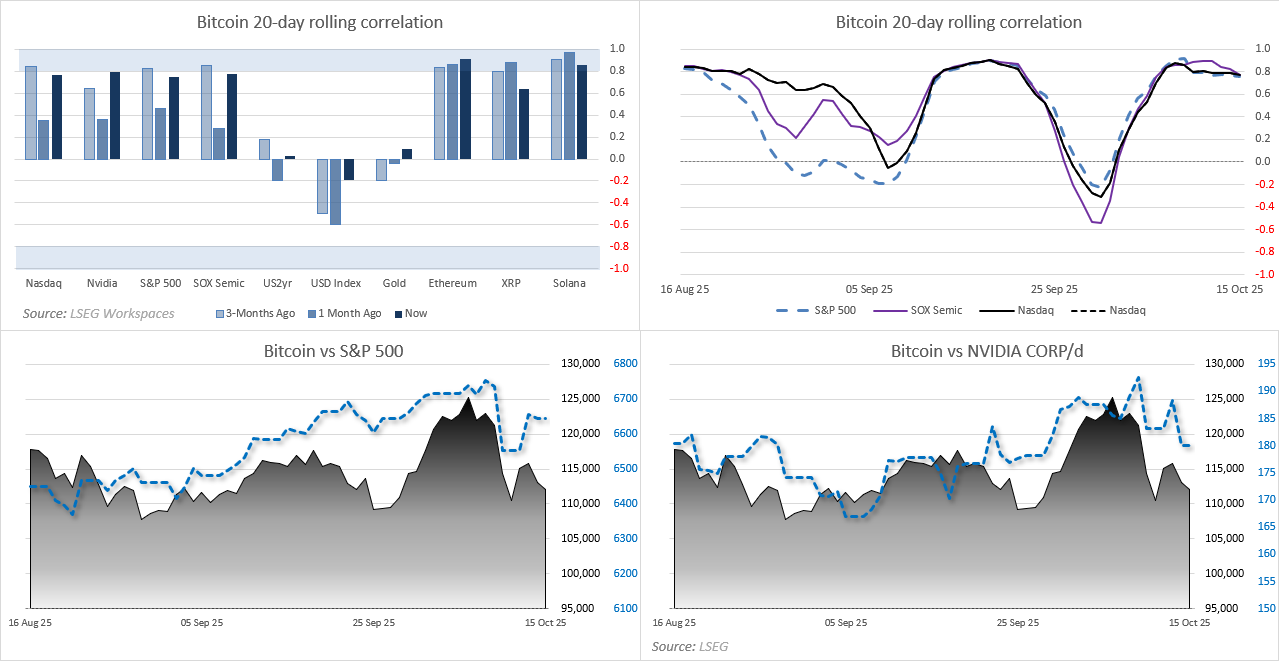
Chart analysis by Matt Simpson - Source: CME, LSEG
S&P 500 Futures (ES) Technical Analysis
Given that Wall Street indices suffered their most volatile session since April on Friday, it’s no surprise to see the S&P 500 meandering within that range. While prices are edging higher, the move appears corrective — suggesting the potential for another leg lower. Also note the bearish divergence on the RSI (14), which warns the S&P 500 could be setting up for a deeper pullback. And although the 50-day EMA held as support, it did so on the first meaningful test of this bullish run. I’m therefore watching for evidence of a swing high on the S&P 500.
The 1-hour chart shows that the largest volume spikes are all bearish. Perhaps S&P 500 bears will find that swing high forming near the 6,741 lows or around the weekly R1 pivot point at 6,758.

Chart analysis by Matt Simpson, Source: TradingView, CME Futures, S&P 500 E-mini Futures


Bitcoin (BTC/USD) Futures Daily Chart:
The daily chart shows a clear momentum shift to the downside from last week’s record high. It almost looks as though the preceding move was a ‘last hurrah’ from bulls, with sentiment now turning against them. The bias is for a break beneath recent swing lows and a move towards the 102k area once a lower high forms on the daily chart.
However, given several nearby support levels and the lower wick on Tuesday’s candle, a short-term bounce may be on the cards. Bulls could seek dips towards the September low and retain a near-term bullish bias while prices remain above 108k, targeting the 120k area.
Bears could either wait for a lower high to form on the daily chart or look for a break below 108k to assume bearish trend continuation.

Chart analysis by Matt Simpson - data source: TradingView Bitcoin CME Futures (BTC1!)
View the full economic calendar
View the full economic calendar
-- Written by Matt Simpson
Follow Matt on Twitter @cLeverEdge
How to trade with City Index
You can trade with City Index by following these four easy steps:
- Open an account, or log in if you’re already a customer
• Open an account in the UK
• Open an account in Australia
• Open an account in Singapore
- Search for the market you want to trade in our award-winning platform
- Choose your position and size, and your stop and limit levels
- Place the trade
Latest market news




The complete CFD trading experience
Award-winning platforms, competitive spreads, low commissions and dedicated support.
We live and breathe the markets and are dedicated to helping traders realise their ambitions as we continue to set the industry bar.
Economic calendar
Web Trader platform
Our sophisticated web-based platform is packed with features.
Related articles
EUR/USD weekly outlook: FOMC and ECB to set the tone
The current backdrop is modestly bearish. On Friday, the EUR/USD closed modestly lower, down for the third consecutive day. The pair also posted a weekly decline after staging a modest recovery attempt in the previous week. Out of the past 8 weeks, the EUR/USD has fallen on 6 occasions. There is not much supporting factors for the single currency right now. So, the upside remains capped.

Crypto Analysis: Even Bitcoin Cannot Escape the Market's Lack of Direction
Major cryptocurrencies continue to trade within a pattern of repeated rebounds without being able to break through key technical barriers, a situation that is gradually giving way to increasingly well-defined consolidation ranges.


Crypto Outlook: Why Is Demand Failing to Recover?
With just one week left in October, the cryptocurrency market continues to struggle to regain consistent demand. Although there was an attempt to recover earlier in the week, the move failed to gain traction and the market quickly returned to a more cautious tone, even as some competing markets began to lose part of their appeal.
StoneX Europe Ltd may make third party material available on this website which may contain information included but not limited to the conditions of financial markets. The material is for information purposes only and does not contain, and should not be construed as containing, investment advice and/or investment recommendation and/or an investment research and/or an offer of or solicitation for any transactions in financial instruments; any decision to enter into a specific transaction shall be made by the client following an assessment by him/her of their situation.
StoneX Europe Ltd makes no representation or warranty and assumes no liability as to the accuracy or completeness of the information provided, nor any loss arising from any investment based on a recommendation, forecast or other information supplied. You should always seek independent advice as to your suitability to speculate in any related markets and your ability to assume the associated risks, if you are at all unsure. We are not under any obligation to update any such material. Any opinion made may be personal to the author and may not reflect the opinion of StoneX Europe Ltd.