




British Pound Technical Analysis: GBP/USD 1.3000 Resistance Test
GBP/USD has shown its strongest monthly gain in March since November of 2023, and the question now is whether bulls can hold the move after testing the key resistance level at 1.3000.
Share this:

British Pound Talking Points:
- GBP/USD put in some effort to break-above the 1.3000 handle, but bulls haven’t yet been able to leave the big figure behind.
- This morning’s UK CPI helped to extend a pullback and that’s allowed for a fresh weekly low; but as of this writing the 1.2900 support level is putting up a fight.
It’s been a strong year so far for GBP/USD, and that probably catches many by surprise given how weak the pair looked into last year’s close. But that sell-off only drove for a couple of weeks into the New Year and since setting a low on January 13th, bulls have been in charge.
So far for this month GBP/USD is up by a little more than 2.5%, which would be the largest monthly gain for the pair since November of 2023; and the third largest since the open of that year.
More recently it’s the 1.3000 psychological level that’s held bulls back from a stronger breakout and as we wind into the end of the month, that’s helped to push a pullback in the pair.
GBP/USD Monthly Chart
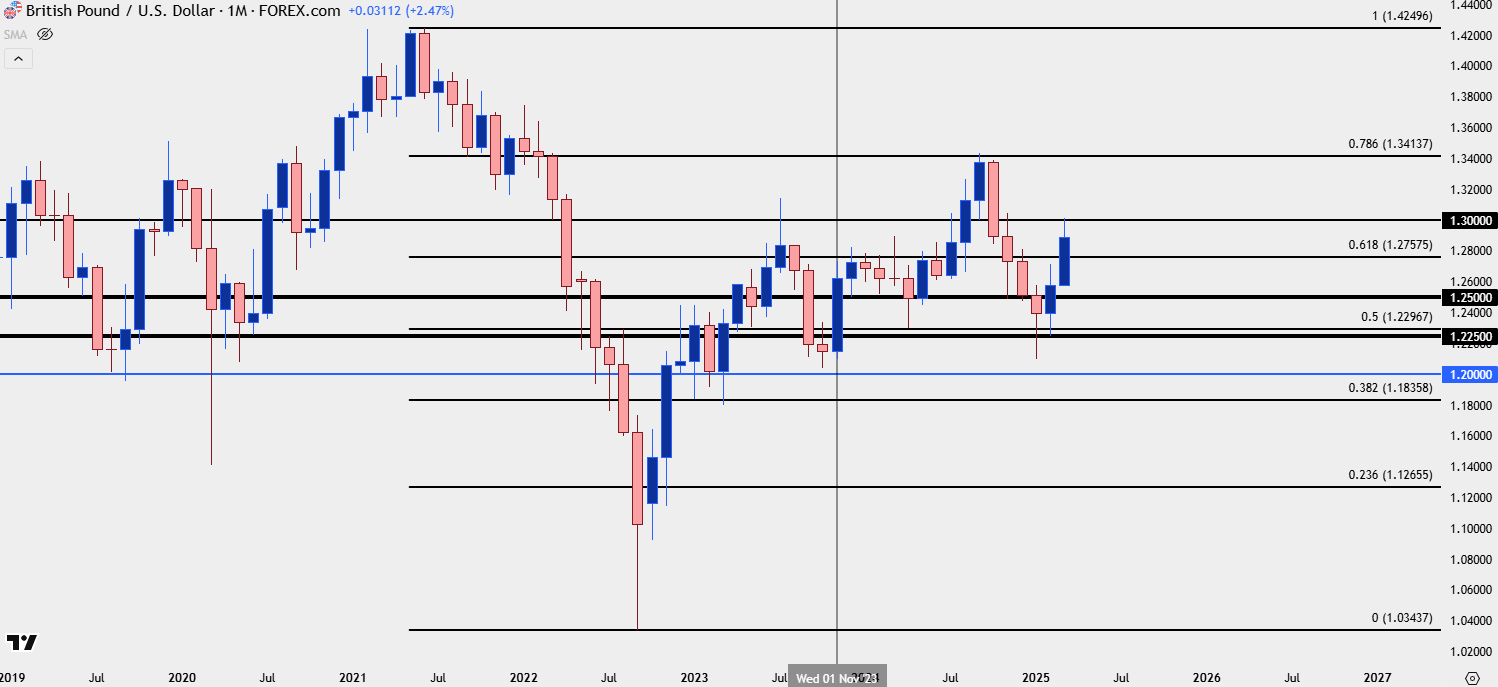 Chart prepared by James Stanley; data derived from Tradingview
GBP/USD Engaging with 1.3000
From the weekly chart we can get a better view of just how aggressively that 1.3000 level has stalled bulls. A doji two weeks ago showed as a lower-high, with buyers unable to get all the way up to the 1.3000 level; but the week after they were able to test above and similarly couldn’t find the drive to continue the bullish trend. Last week’s candle also closed as indecisive, although the wider body makes it look more like a spinning top than a doji.
And, so far this week, that stalling at resistance has followed through with another red weekly candle as the pullback has continued thus far.
GBP/USD Weekly Chart
 Chart prepared by James Stanley; data derived from Tradingview
GBP/USD Shorter-Term
Interestingly if we look at the US Dollar as the mirror image of this move, the bounce in USD has been a larger pullback in the 2025 sell-off in DXY than the pullback has been in GBP/USD. As such, this can keep GBP/USD as attractive for USD-weakness scenarios, as the GBP-strength that’s helped the pair to hold up a bit better than the Euro is something that could make another run of USD-weakness show more prominently. But, as of right now, we have to call this what it is as this morning has produced a fresh lower-low and that goes along with the earlier-week stall inside of the 1.3000 level, which could end up as a lower-high.
For today’s daily bar I think that the 1.2900 level is key: This is the 38.2% Fibonacci retracement of the 2023-2024 major move in the pair, and this is what had helped to set support until this morning’s push to a fresh low. As of this writing it appears as though bulls are responding to that pullback with price attempting to pull back above the 1.2900 level, and if the daily closes like this, it could look attractive as a defense of support.
GBP/USD Daily Chart
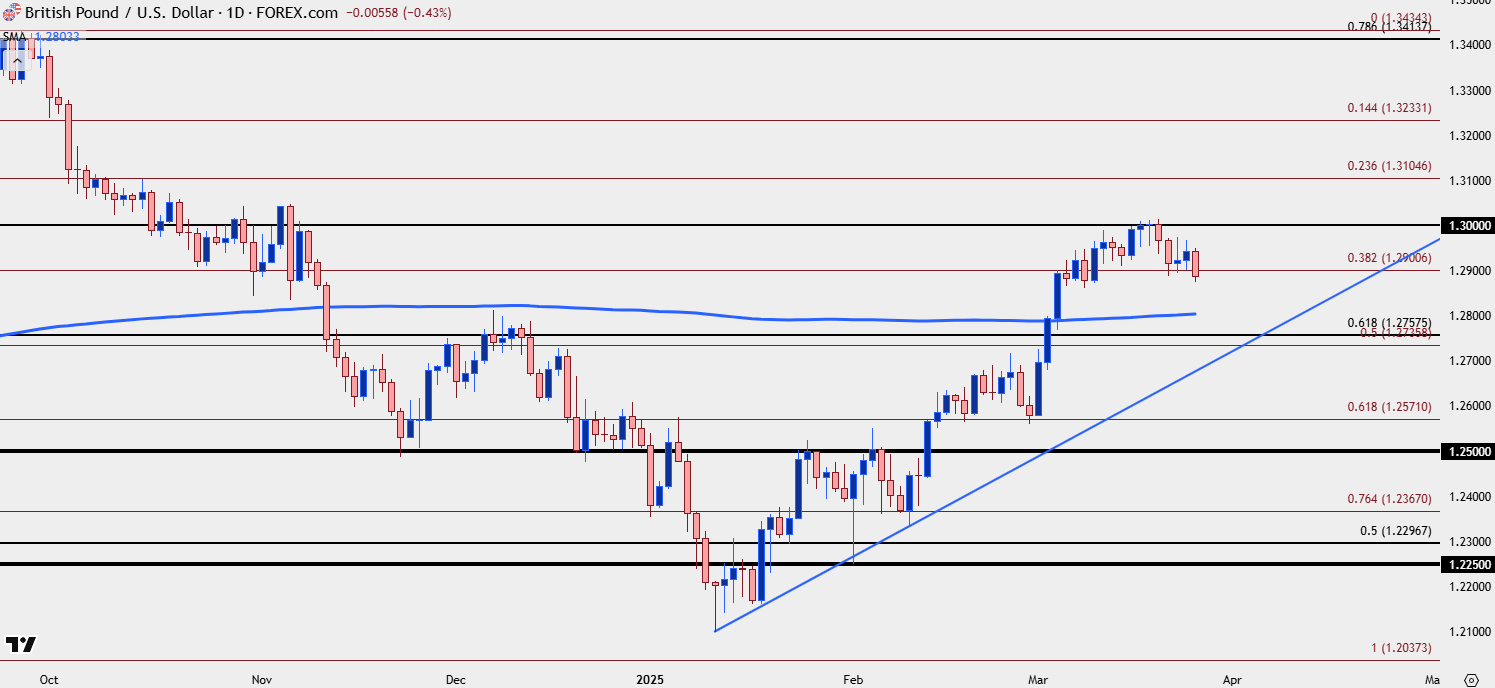 Chart prepared by James Stanley; data derived from Tradingview
--- written by James Stanley, Senior Strategist
British Pound Talking Points:
- GBP/USD put in some effort to break-above the 1.3000 handle, but bulls haven’t yet been able to leave the big figure behind.
- This morning’s UK CPI helped to extend a pullback and that’s allowed for a fresh weekly low; but as of this writing the 1.2900 support level is putting up a fight.
It’s been a strong year so far for GBP/USD, and that probably catches many by surprise given how weak the pair looked into last year’s close. But that sell-off only drove for a couple of weeks into the New Year and since setting a low on January 13th, bulls have been in charge.
So far for this month GBP/USD is up by a little more than 2.5%, which would be the largest monthly gain for the pair since November of 2023; and the third largest since the open of that year.
More recently it’s the 1.3000 psychological level that’s held bulls back from a stronger breakout and as we wind into the end of the month, that’s helped to push a pullback in the pair.
GBP/USD Monthly Chart

GBP/USD Engaging with 1.3000
From the weekly chart we can get a better view of just how aggressively that 1.3000 level has stalled bulls. A doji two weeks ago showed as a lower-high, with buyers unable to get all the way up to the 1.3000 level; but the week after they were able to test above and similarly couldn’t find the drive to continue the bullish trend. Last week’s candle also closed as indecisive, although the wider body makes it look more like a spinning top than a doji.
And, so far this week, that stalling at resistance has followed through with another red weekly candle as the pullback has continued thus far.
GBP/USD Weekly Chart
GBP/USD Shorter-Term
Interestingly if we look at the US Dollar as the mirror image of this move, the bounce in USD has been a larger pullback in the 2025 sell-off in DXY than the pullback has been in GBP/USD. As such, this can keep GBP/USD as attractive for USD-weakness scenarios, as the GBP-strength that’s helped the pair to hold up a bit better than the Euro is something that could make another run of USD-weakness show more prominently. But, as of right now, we have to call this what it is as this morning has produced a fresh lower-low and that goes along with the earlier-week stall inside of the 1.3000 level, which could end up as a lower-high.
For today’s daily bar I think that the 1.2900 level is key: This is the 38.2% Fibonacci retracement of the 2023-2024 major move in the pair, and this is what had helped to set support until this morning’s push to a fresh low. As of this writing it appears as though bulls are responding to that pullback with price attempting to pull back above the 1.2900 level, and if the daily closes like this, it could look attractive as a defense of support.
GBP/USD Daily Chart
--- written by James Stanley, Senior Strategist
Related tags:




The complete CFD trading experience
Award-winning platforms, competitive spreads, low commissions and dedicated support.
We live and breathe the markets and are dedicated to helping traders realise their ambitions as we continue to set the industry bar.
Economic calendar
Web Trader platform
Our sophisticated web-based platform is packed with features.
Related articles
Euro Weekly Forecast: EUR/USD Dawdles At Lows Despite Daily RSI Oversold
Despite a deep oversold read bulls didn’t exactly come screaming back into the EUR/USD market, although a series of higher-lows may be an early warning that a turning point may be near.

US Dollar Price Action Setups: EUR/USD, USD/JPY, GBP/USD, USD/CAD
The US Dollar remained strong last week even as EUR/USD started to show a series of higher-lows. USD/JPY continues to be bought on dips as the fundamental deviation between the two economies remains front-and-center.

Australian Dollar Short-term Outlook: AUD/USD Rebound Challenges September Downtrend 10 9 2026
Aussie is pressing a key trend barrier after rebounding from support, with next week’s CPI report poised to test the recovery.

StoneX Europe Ltd may make third party material available on this website which may contain information included but not limited to the conditions of financial markets. The material is for information purposes only and does not contain, and should not be construed as containing, investment advice and/or investment recommendation and/or an investment research and/or an offer of or solicitation for any transactions in financial instruments; any decision to enter into a specific transaction shall be made by the client following an assessment by him/her of their situation.
StoneX Europe Ltd makes no representation or warranty and assumes no liability as to the accuracy or completeness of the information provided, nor any loss arising from any investment based on a recommendation, forecast or other information supplied. You should always seek independent advice as to your suitability to speculate in any related markets and your ability to assume the associated risks, if you are at all unsure. We are not under any obligation to update any such material. Any opinion made may be personal to the author and may not reflect the opinion of StoneX Europe Ltd.