



BTC/USD Breaks Higher. Is the Bitcoin Tide Turning?
Bullish signals and momentum shifts hint at a trend reversal. Is it time to position for upside?
Share this:

- Dips below $108K bought aggressively
- BTC/USD breaks downtrend, momentum bullish
- Watch $113,500 support and $116K resistance.
Summary
The tide may be turning for BTC/USD.
With buyers lining up to buy dips below $108,000 last week, delivering an engulfing candle on Thursday, the bullish signals continue to pile up for bitcoin. Earlier today, the price smashed through the downtrend from the record highs, helped by extremely elevated risk appetite that has seen major equity indices across Asia surge to record levels.
With bullish momentum signals being triggered across an increasing number of timeframes, the path of least resistance may now be higher, not lower.
BTC/USD Bear Phase Over?
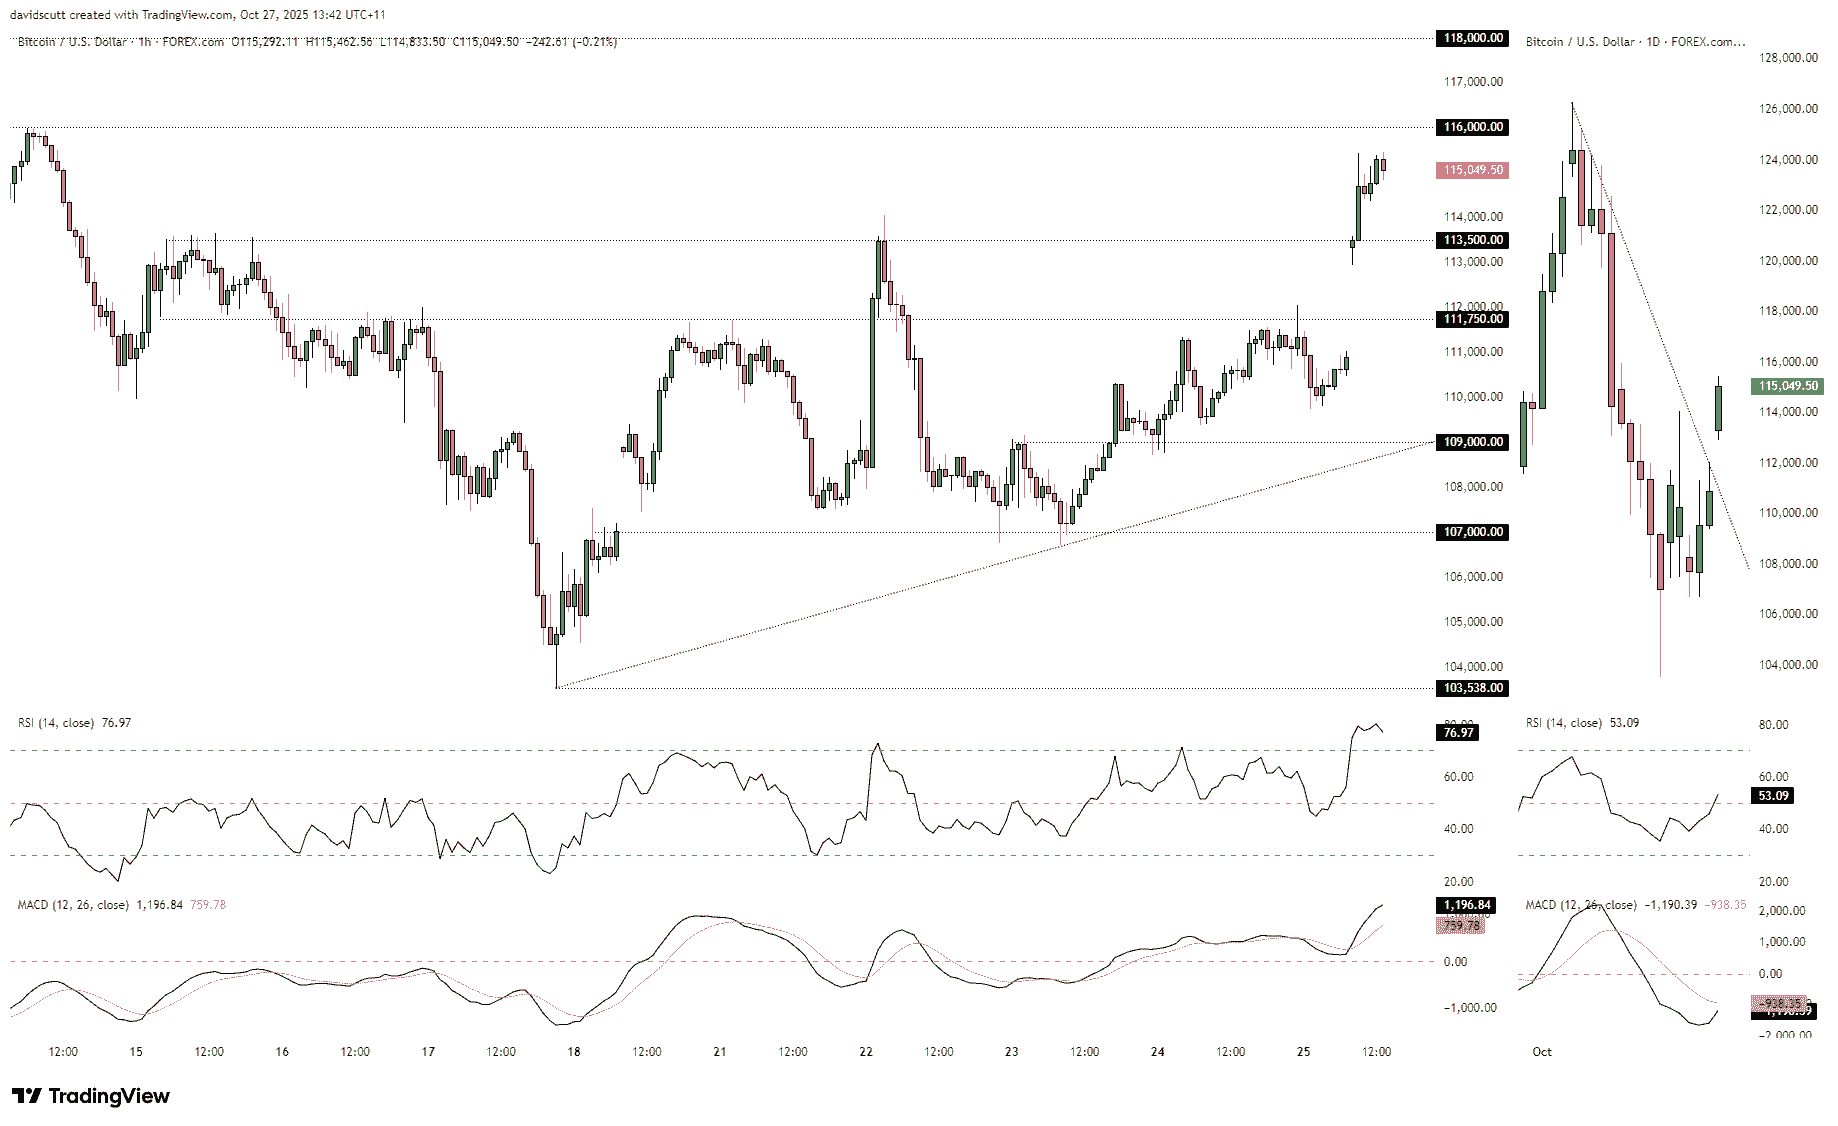
The chart below is split into two panes, with the larger one on the left looking at BTC/USD price action using an hourly tick while the smaller one on the right is the daily. This not only makes it easier to see relevant levels for shorter timeframes but also longer-term signals and trends, providing a decent indicator of where directional risks may lie. Right now, the latter suggests the bearish trend seen this month may have run its course.
Source: TradingView
Prior to the downtrend break seen earlier today, bearish moves beneath $108,000 were continuously bought over the past fortnight. The last iteration on Thursday delivered an engulfing candle, with the bullish signal proving accurate given the price action since.
The momentum picture on the daily timeframe is also shifting, with RSI (14) trending higher above 50, delivering an increasingly bullish signal. MACD has yet to confirm but is rapidly approaching the signal line from below, on track to deliver a crossover in negative territory that reinforces the view that the tide may be turning.
Turning to the hourly chart, it gives a sense of the levels to consider when assessing potential setups. Bulls made quick work of resistance above $113,500 early in the session, pushing the price to multi-week highs. Above where BTC/USD currently trades, resistance is located at $116,000, a level that capped the price over two days earlier this month.
On the downside, $113,500 may now revert to offering support, providing a potential entry level for bulls where longs could be established above with a stop beneath for protection. Given the price is struggling above $115,000 right now, a pullback is not out of the realms of possibility in the short term.
If the bullish trend seen earlier in the session resumes, $116,000 is another level that could be used to establish positions, offering both bullish and bearish setups depending on how the price interacts with it should it get there. A clean break above would allow for longs to be set with a stop beneath, targeting resistance at $118,000. But if it can’t break above the level, another option would be to set shorts below with a stop above, targeting either $114,400 where bids were noted earlier today or even $113,500.
RSI (14) sits above 70, indicating overbought conditions on the hourly that warn of near-term reversal risk. MACD continues to deliver a bullish message, crossing the signal line from below in positive territory earlier before trending higher. Unless you’re an ultra short-term scalper, the preference would be to buy dips given the macro environment.
Related tags:



The complete CFD trading experience
Award-winning platforms, competitive spreads, low commissions and dedicated support.
We live and breathe the markets and are dedicated to helping traders realise their ambitions as we continue to set the industry bar.
Economic calendar
Web Trader platform
Our sophisticated web-based platform is packed with features.
Related articles

Bitcoin Analysis: Is Uncertainty Returning to BTC?
Recent trading sessions have not been particularly supportive of a clear directional move in Bitcoin. This can be seen in the behavior of the price over the last four sessions, where fluctuations have remained close to 1.00% without establishing a consistent trend. As a result, a growing sense of neutrality is beginning to emerge around BTC.


AUD/USD outlook: Aussie slips despite hawkish RBA ahead of key data
The AUD/USD was unable to benefit from the Reserve Bank of Australia’s 25-basis-point rate hike overnight. The RBA lifted the cash rate to 4.60%, in line with expectations. However, the Australian dollar weakened following the decision, with much of the Bank’s hawkish stance seemingly priced in ahead of the announcement. The US dollar has also remained largely supported following the recent turmoil in the bond markets.


RBA delivers 25bp hike, Bullock now the main event
The RBA delivered the expected 25bp hike, but Bullock’s press conference now looms as the bigger volatility risk for AUD/USD and the ASX 200.
StoneX Europe Ltd may make third party material available on this website which may contain information included but not limited to the conditions of financial markets. The material is for information purposes only and does not contain, and should not be construed as containing, investment advice and/or investment recommendation and/or an investment research and/or an offer of or solicitation for any transactions in financial instruments; any decision to enter into a specific transaction shall be made by the client following an assessment by him/her of their situation.
StoneX Europe Ltd makes no representation or warranty and assumes no liability as to the accuracy or completeness of the information provided, nor any loss arising from any investment based on a recommendation, forecast or other information supplied. You should always seek independent advice as to your suitability to speculate in any related markets and your ability to assume the associated risks, if you are at all unsure. We are not under any obligation to update any such material. Any opinion made may be personal to the author and may not reflect the opinion of StoneX Europe Ltd.