



BTC/USD: Dead-cat bounce or the start of another recovery?
Bitcoin has bounced aggressively after another test of its 50-day moving average, but tech futures remain under pressure. With equity correlations strengthening and bearish momentum building, can BTC/USD sustain the recovery?
Share this:

- Bitcoin rebounds sharply despite continued weakness in technology futures
- BTC/USD correlations with Nasdaq, SOX and Kospi futures strengthen
- Bearish reversal signals favour selling rallies, with $82,277.67 in focus
Bitcoin has had a volatile session in Asia, closely tracking the sell-off in technology-related futures. However, after an initial lurch lower, we've seen a sharp reversal take place.
What's notable is that we haven't seen a recovery in technology-related stock futures accompany it, putting a question mark over whether the rebound is anything more than a dead-cat bounce.
Bitcoin's relationship with equity futures strengthens
Source: TradingView, LSEG
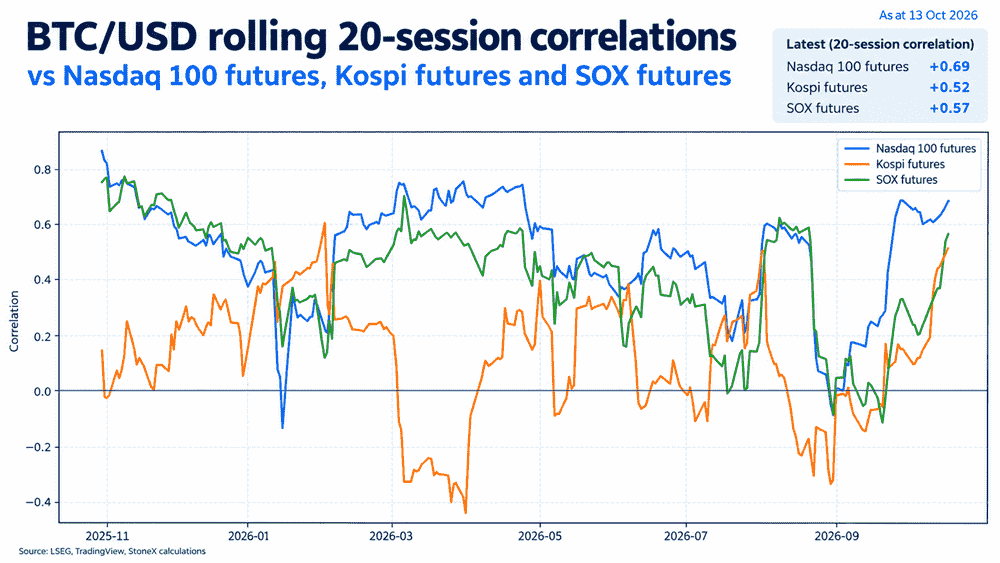
While the correlations aren't at particularly extreme levels, its noticeable how the relationship between Bitcoin and tech-linked equity futures has strengthened since the beginning of October, particularly over the rolling 20-session window.
The latest readings stand at +0.69 against Nasdaq 100 futures, +0.57 against SOX futures and +0.52 against Kospi futures.
It suggests Bitcoin may be reverting to its old ways of acting as a barometer of risk sentiment and potentially a proxy for global liquidity. Whatever the underlying factor, Bitcoin is increasingly moving in lockstep with broader risk sentiment, particularly in the AI-related space.
Bearish reversals point to downside risks
Source: TradingView
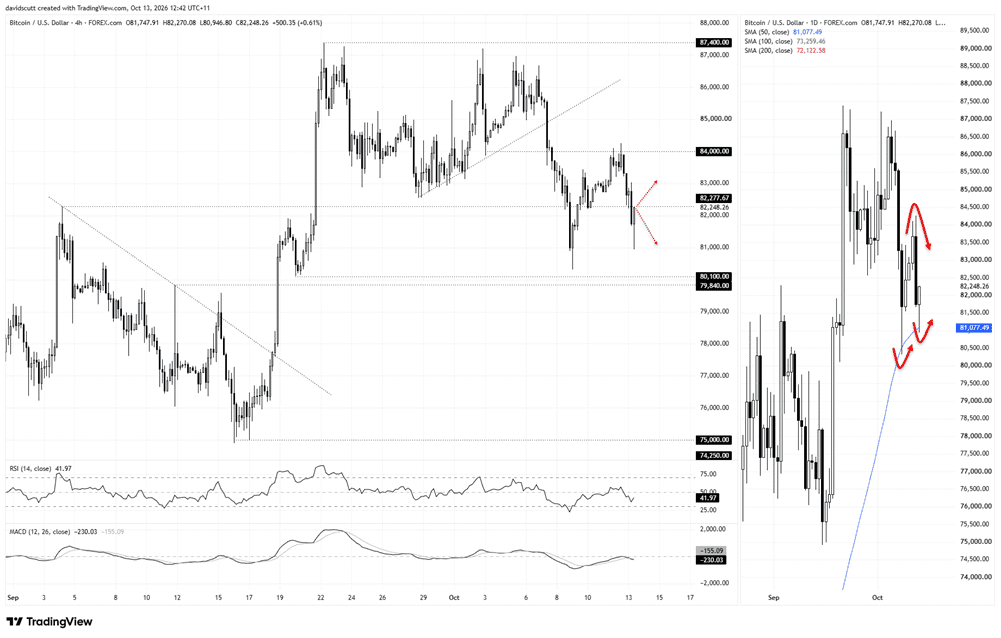
Turning to the charts, we've seen a bearish key reversal on the daily timeframe, while on the four-hourly chart, a bearish engulfing candle emerged after the price stalled above $84,000, followed by another that took BTC/USD beneath support at $82,277.67.
While the daily key reversal hasn't appeared following a prolonged bull market run, the price action across both timeframes suggests downside risks are elevated.
We saw that initially in early Asian trade, with the price tumbling beneath $81,000, where the 50-day moving average is located, before bouncing aggressively, as was the case earlier this month.
Looking at the four-hourly timeframe on the left, the immediate level I'm watching overhead is $82,277.67, which marked the swing high set in early September and has subsequently flipped between support and resistance on several occasions this month.
Should we see a backtest and rejection of $82,277.67, it would present an opportunity to initiate shorts with a tight stop above the level for protection, targeting initially the 50-day moving average around $81,000.
Beyond that, the next natural level to watch is last week's low at $80,319.46, followed by the support zone between $80,100 and $79,840.
Alternatively, should the price break convincingly above $82,277.67 and hold there, it would present an opportunity to initiate longs with a tight stop beneath the level for protection, targeting a retest of resistance at $84,000. The $83,000 level is also worth watching in between, having briefly stalled the price overnight.
The message from the oscillators on the four-hourly timeframe is one of building downside pressure, with RSI (14) setting lower highs and now sitting beneath the neutral 50 level, while MACD has staged a bearish crossover, confirming the bearish momentum signal.
That favours selling into strength and downside breaks, although I'm placing greater emphasis on price action when it comes to trade selection.

The complete CFD trading experience
Award-winning platforms, competitive spreads, low commissions and dedicated support.
We live and breathe the markets and are dedicated to helping traders realise their ambitions as we continue to set the industry bar.
Economic calendar
Web Trader platform
Our sophisticated web-based platform is packed with features.
Related articles

BTC/USD: Dead-cat bounce or the start of another recovery?
Bitcoin has bounced aggressively after another test of its 50-day moving average, but tech futures remain under pressure. With equity correlations strengthening and bearish momentum building, can BTC/USD sustain the recovery?

GBP/AUD falling wedge points to bullish breakout risk ahead of RBA minutes
GBP/AUD is forming a potential bullish continuation pattern, with RBA minutes, Australian unemployment and Bank of England commentary among the catalysts that could spark a breakout.

EUR/USD Forecast: Euro Slips to 17-Month Lows, 1.11 Next?
EUR/USD is trading at 17-month lows near 1.1160 as political developments in Germany and Spain inject uncertainty into the euro’s outlook - where is the next support ahead of US CPI?

StoneX Europe Ltd may make third party material available on this website which may contain information included but not limited to the conditions of financial markets. The material is for information purposes only and does not contain, and should not be construed as containing, investment advice and/or investment recommendation and/or an investment research and/or an offer of or solicitation for any transactions in financial instruments; any decision to enter into a specific transaction shall be made by the client following an assessment by him/her of their situation.
StoneX Europe Ltd makes no representation or warranty and assumes no liability as to the accuracy or completeness of the information provided, nor any loss arising from any investment based on a recommendation, forecast or other information supplied. You should always seek independent advice as to your suitability to speculate in any related markets and your ability to assume the associated risks, if you are at all unsure. We are not under any obligation to update any such material. Any opinion made may be personal to the author and may not reflect the opinion of StoneX Europe Ltd.