


Gold Rallies Towards a $4k Test – but Can Bulls Break the Trend?
Gold prices melted down last week but so far this week, a different tone has taken over. But can this turn into anything more than a short squeeze?
Share this:

Gold Talking Points:
- Gold prices re-tested $4k last week and unlike June/July, sellers were able to slice through.
- A bid has shown so far to start this week but with Treasuries seeing capital flows the big question is whether gold can reverse course or whether bears have more room to run before a tradeable low appears.
As risk aversion has hit global markets, gold hasn’t been able to escape unscathed and the metal continues to reverse gains from the prior two-year rally. While the $4k level held the lows well back in June and July, it was unable to do the same last week as sellers sank price down to a fresh yearly low. So far this week, a bounce has developed, but there was some technical damage from the sell-off that would make it difficult to dismiss the possibility of further lows, at this point.
Gold Weekly Price Chart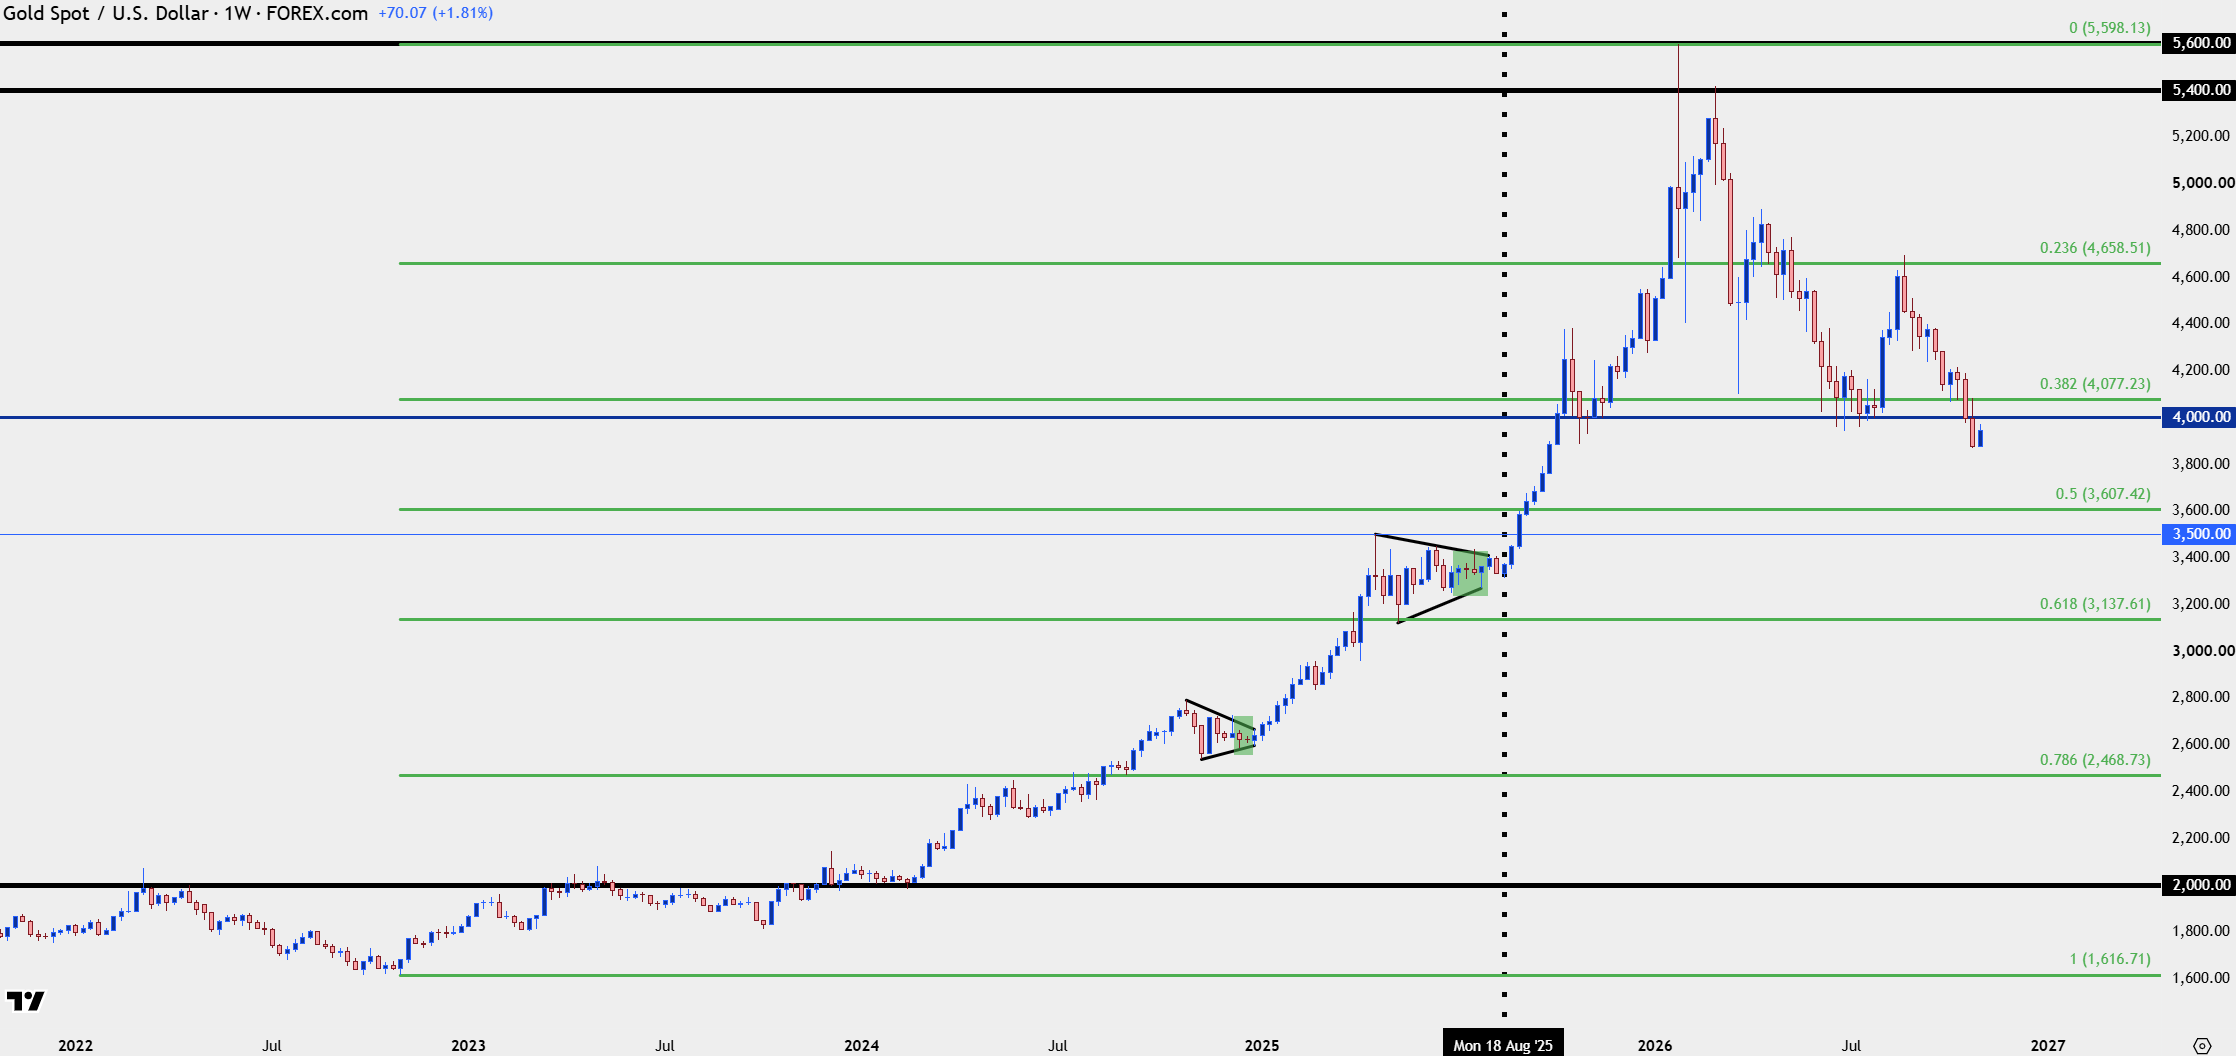
Chart prepared by James Stanley; data derived from Tradingview
Gold Daily: Sellers Attack
Two weeks ago gold closed below $4k on a weekly basis for the first time in over a year. Notably, despite multiple tests this summer, buyers continued to come in to bid prices above the big figure by the weekly close. But two weeks ago, that didn’t happen, and while last week started with an optimistic bounce, resistance played in at prior support, around the $4077 level which is the 23.6% retracement of the 2022-2026 major move. That led to a lower low after a lower high and this illustrates continued bearish control in the pair.
Gold Daily Price Chart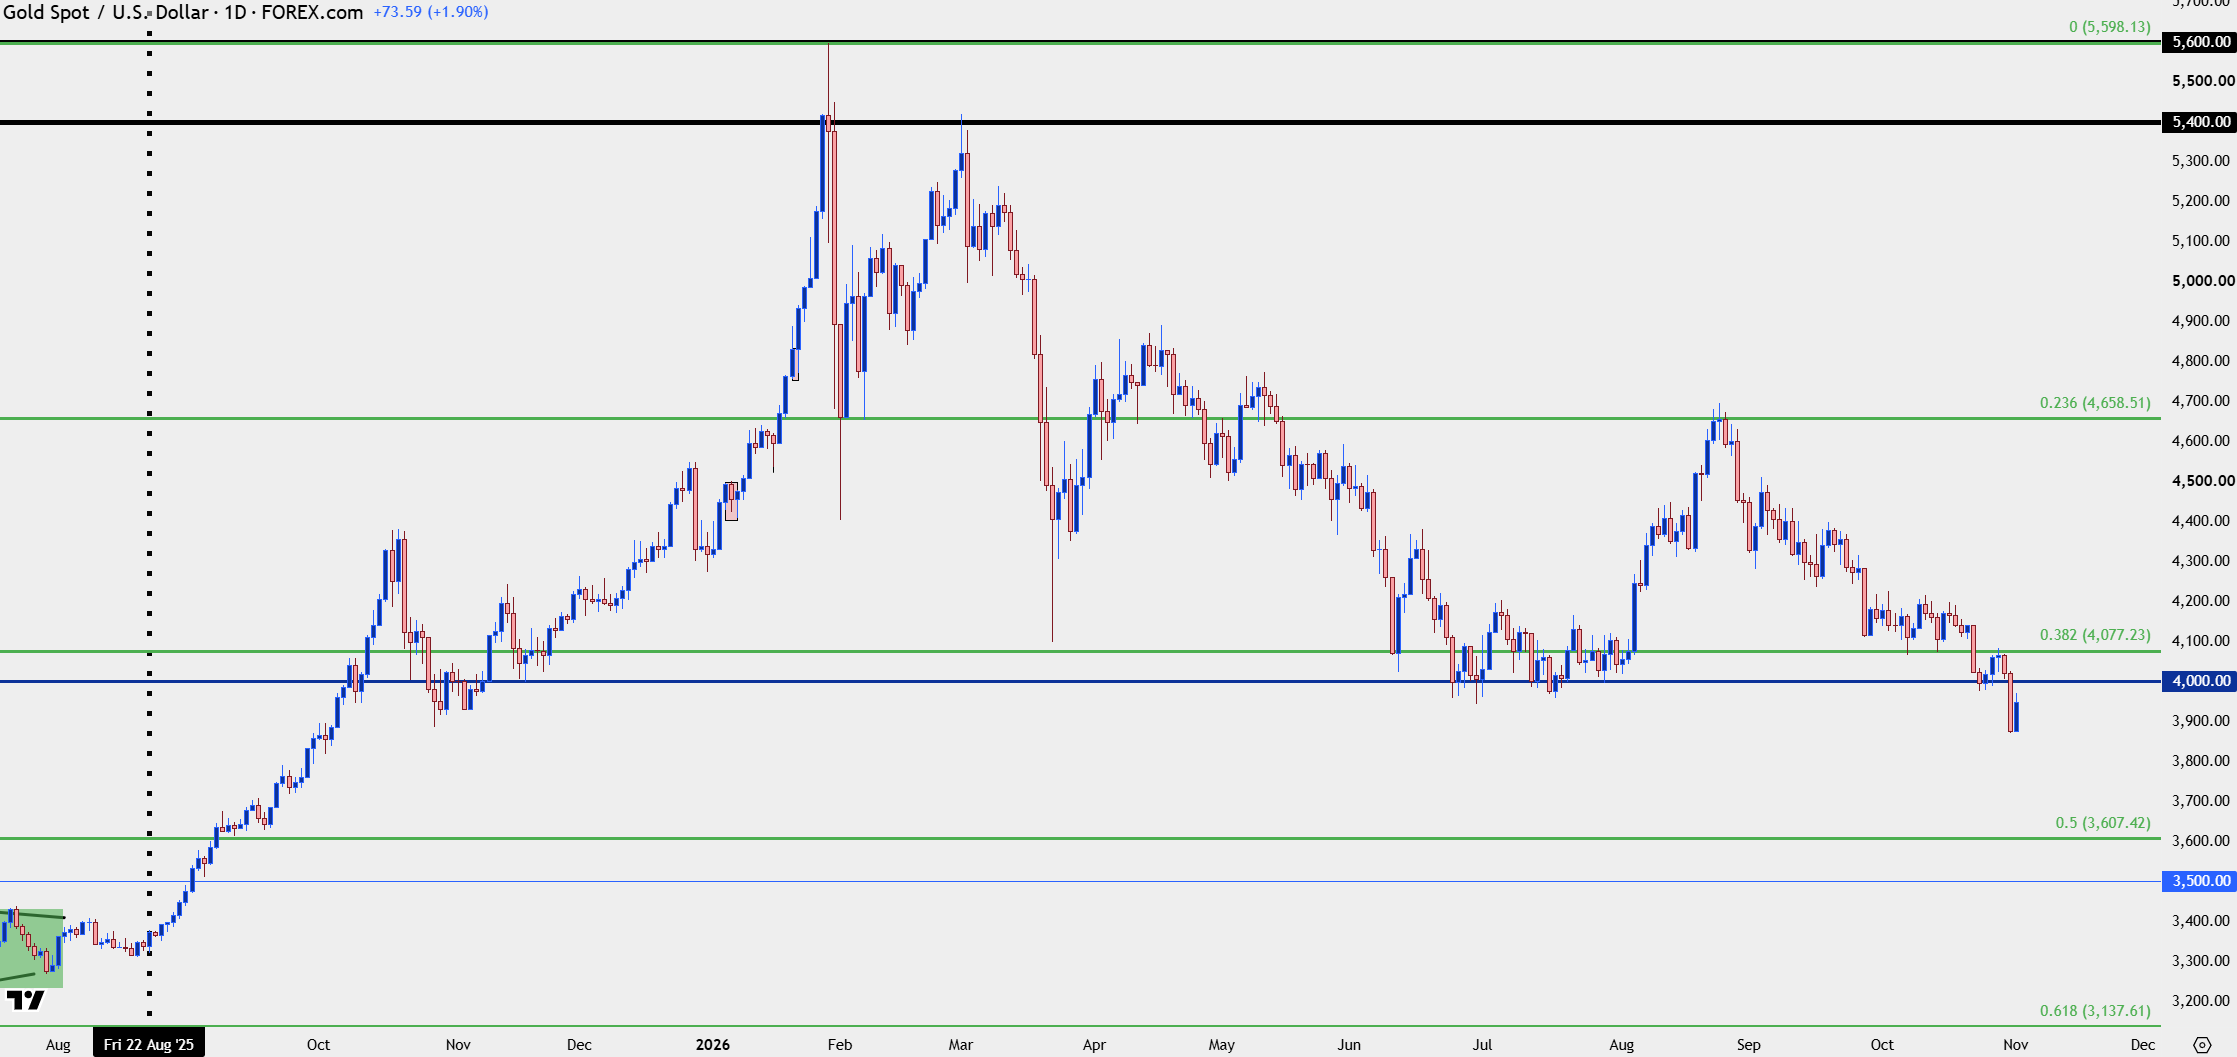
Chart prepared by James Stanley; data derived from Tradingview
Gold Short-Term
So far, bulls have pulled up just shy of prior support which was at $3975. I’ve linked that up to $4k to establish a zone of resistance, with the $4021 swing just above that and then the $4077 Fibonacci level on top of that. Each price represents a spot where sellers can jump in for defense as this defines the recent bearish structure in gold.
If bulls can force a break through that prior lower-high, then the door can open for short-term reversal potential, with the $4111 level above that, and then a major zone from $4217-4235. If or when that zone gets traded through, then the prospect of bigger picture reversals can gain more attraction as this was a hard-fought area on the chart when the trend was breaking down.
Gold Four-Hour Chart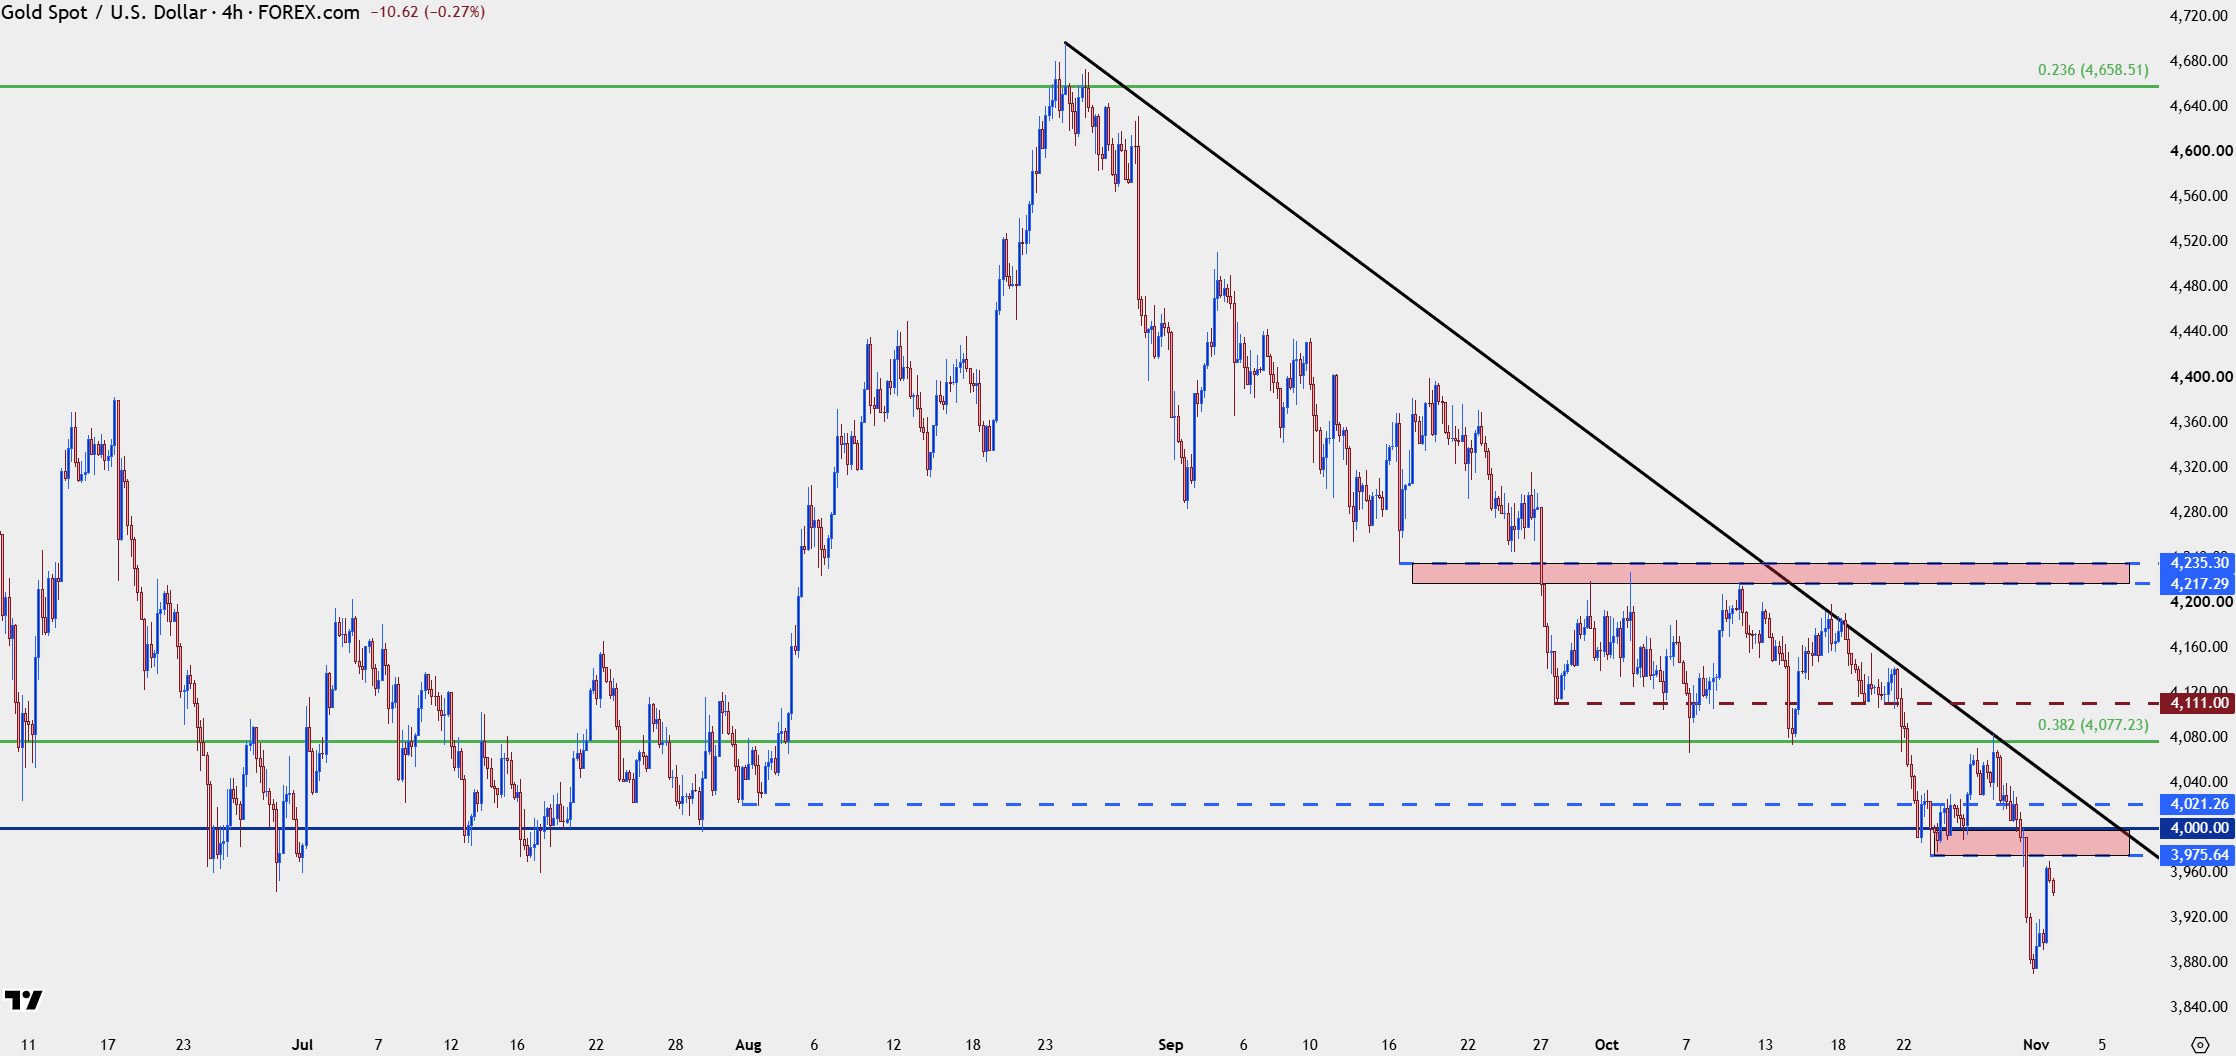
Chart prepared by James Stanley; data derived from Tradingview
--- written by James Stanley, Senior Market Analyst, Global Macro
Related tags:
Latest market news



The complete CFD trading experience
Award-winning platforms, competitive spreads, low commissions and dedicated support.
We live and breathe the markets and are dedicated to helping traders realise their ambitions as we continue to set the industry bar.
Economic calendar
Web Trader platform
Our sophisticated web-based platform is packed with features.
Related articles
Gold Rallies Towards a $4k Test – but Can Bulls Break the Trend?
Gold prices melted down last week but so far this week, a different tone has taken over. But can this turn into anything more than a short squeeze?
Gold forecast: XAU/USD stabilised after recent falls – for now
Gold has started the first week of the new month trying to recover some ground after another bruising week. Oil prices have taken a sharp drop and that has allowed risk assets to bounce back, which has clearly helped the precious metal too. However, with sentiment remaining bearish towards the metals, and with $4000 level having been taken out last week, the path of least resistance is to the downside for gold.


EUR/USD, Oil Forecast: Two trades to watch
EUR/USD rises as lower oil prices offset weak German retail sales. Gold rebounds from 2026 lows after the worst October in 18 years.

StoneX Europe Ltd may make third party material available on this website which may contain information included but not limited to the conditions of financial markets. The material is for information purposes only and does not contain, and should not be construed as containing, investment advice and/or investment recommendation and/or an investment research and/or an offer of or solicitation for any transactions in financial instruments; any decision to enter into a specific transaction shall be made by the client following an assessment by him/her of their situation.
StoneX Europe Ltd makes no representation or warranty and assumes no liability as to the accuracy or completeness of the information provided, nor any loss arising from any investment based on a recommendation, forecast or other information supplied. You should always seek independent advice as to your suitability to speculate in any related markets and your ability to assume the associated risks, if you are at all unsure. We are not under any obligation to update any such material. Any opinion made may be personal to the author and may not reflect the opinion of StoneX Europe Ltd.