




Calm before the Storm SP500
The S&P 500 is in wait-and-see mode ahead of the FOMC
Share this:

It was a quiet day for the S&P 500. The Index was near unchanged on Tuesday as we head into the Fed meeting on Wednesday afternoon. The big question everyone is waiting to hear the answer to is: Will the Fed address the move higher in interest rates (some 65 basis points in 10-year yields) since the last meeting, and if so, how? Will the Fed be restructuring the bond buying program (currently at $80 billion of Treasuries and $40 billion MBS per month)? Perhaps they will provide a rosier outlook in the dot plot, in which they would move the timeframe forward as to when they would expect to hike rates. Or maybe they do nothing…and continue with the ongoing theme that inflation expectations are transitory and the rise in yields is unsustainable. See our full Fed preview.
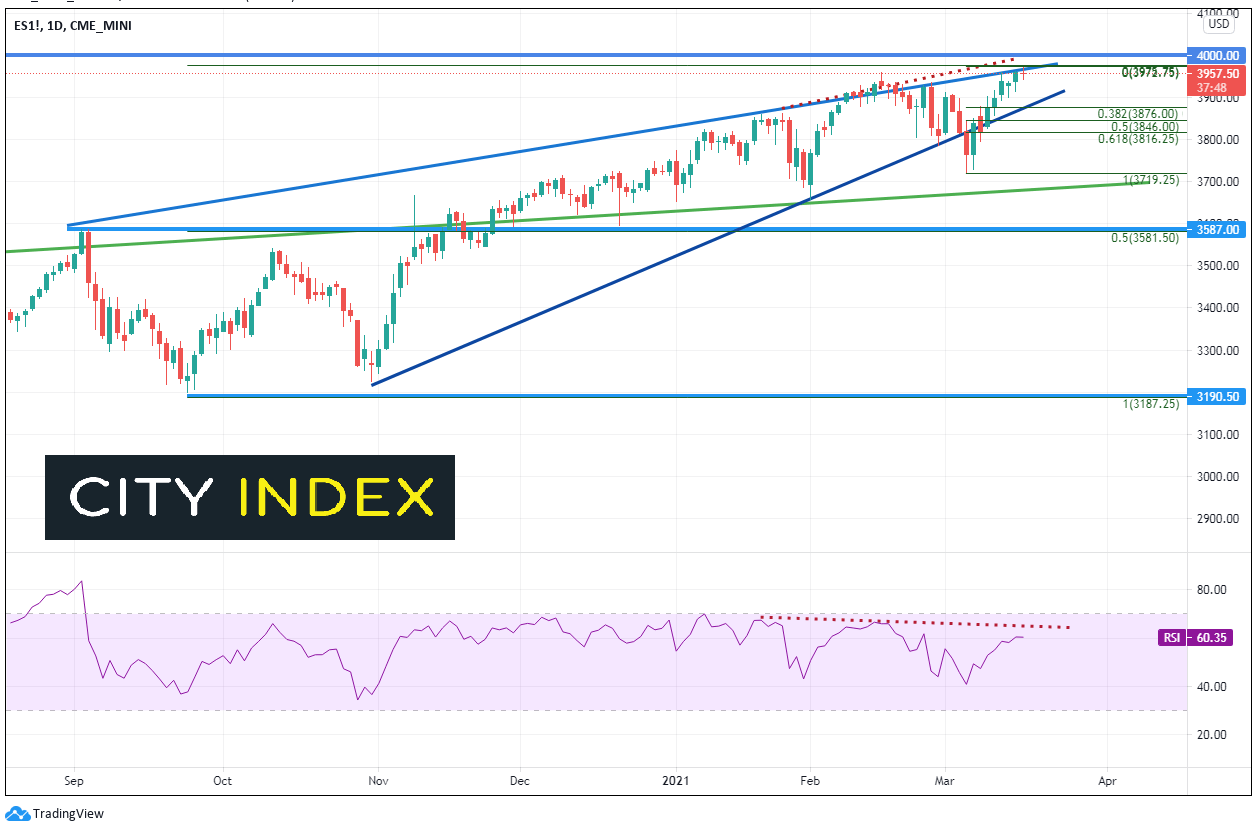
It seems though, that the large cap S&P 500 is in wait-and-see mode. The index is near unchanged on the day after reaching new highs earlier in the session. However, the range on the day is only 28 handles. If prices do decide to pull back after the meeting, it wouldn’t be that unexpected. Price is grinding up against the top trendline of and ascending wedge and the psychological round number resistance near 4,000. The RSI is diverging with price. Perhaps a spike through 4,000, take out stops, then a pullback? Maybe.
Source: Tradingview, City Index
But if price did pullback, how low could it go? The most immediate level is the confluence of support near the 38.2% Fibonacci retracement from the lows of March 4th to the highs on March 16th, and the upward sloping bottom trendline of the ascending channel near 3876. Below there is the 50% retracement level and the 61.8% Fibonacci retracement from the same timeframe near 3846 and 3816,25, respectively. Below there is March 4th lows near 3719.25.
Everything you need to know about the Federal Reserve
Longer term, if 10-year yields continue to rise, we can expect S&Ps to fall even further. The upward sloping green trendline dates all the way back to January 2018, which crosses near 3675. And then is horizontal support from previous highs near 3587, which also happens to be the 50% retracement level from the September 24th lows to Tuesdays highs.
If price breaks below there, the expected target for an ascending wedge, which is a 100% retracement, comes into play. Below 3587, price looks like if could fall rapidly to the target and horizontal support near 3190.
It was a very quiet Tuesday. Expect the same heading into the meeting on Wednesday. If the Fed gives the sense that they may begin sooner than later, the Jenga tower may be ready to fall over.
Learn more about index trading opportunities.
It was a quiet day for the S&P 500. The Index was near unchanged on Tuesday as we head into the Fed meeting on Wednesday afternoon. The big question everyone is waiting to hear the answer to is: Will the Fed address the move higher in interest rates (some 65 basis points in 10-year yields) since the last meeting, and if so, how? Will the Fed be restructuring the bond buying program (currently at $80 billion of Treasuries and $40 billion MBS per month)? Perhaps they will provide a rosier outlook in the dot plot, in which they would move the timeframe forward as to when they would expect to hike rates. Or maybe they do nothing…and continue with the ongoing theme that inflation expectations are transitory and the rise in yields is unsustainable. See our full Fed preview.
It seems though, that the large cap S&P 500 is in wait-and-see mode. The index is near unchanged on the day after reaching new highs earlier in the session. However, the range on the day is only 28 handles. If prices do decide to pull back after the meeting, it wouldn’t be that unexpected. Price is grinding up against the top trendline of and ascending wedge and the psychological round number resistance near 4,000. The RSI is diverging with price. Perhaps a spike through 4,000, take out stops, then a pullback? Maybe.
Source: Tradingview, FOREX.com
But if price did pullback, how low could it go? The most immediate level is the confluence of support near the 38.2% Fibonacci retracement from the lows of March 4th to the highs on March 16th, and the upward sloping bottom trendline of the ascending channel near 3876. Below there is the 50% retracement level and the 61.8% Fibonacci retracement from the same timeframe near 3846 and 3816,25, respectively. Below there is March 4th lows near 3719.25.
Everything you need to know about the Federal Reserve
Longer term, if 10-year yields continue to rise, we can expect S&Ps to fall even further. The upward sloping green trendline dates all the way back to January 2018, which crosses near 3675. And then is horizontal support from previous highs near 3587, which also happens to be the 50% retracement level from the September 24th lows to Tuesdays highs.
If price breaks below there, the expected target for an ascending wedge, which is a 100% retracement, comes into play. Below 3587, price looks like if could fall rapidly to the target and horizontal support near 3190.
It was a very quiet Tuesday. Expect the same heading into the meeting on Wednesday. If the Fed gives the sense that they may begin sooner than later, the Jenga tower may be ready to fall over.
Learn more about index trading opportunities.
Latest market news




The complete CFD trading experience
Award-winning platforms, competitive spreads, low commissions and dedicated support.
We live and breathe the markets and are dedicated to helping traders realise their ambitions as we continue to set the industry bar.
Economic calendar
Web Trader platform
Our sophisticated web-based platform is packed with features.
Related articles
USD/JPY Q4 2026 Outlook: Hawkish Fed Pricing Clashes With Intervention Risk
The year-end tug-of-war is clear: hawkish Fed pricing supports USD/JPY, while intervention risk limits the upside.
USD/CAD and USD/MXN Q4 2026 Outlook: Will the U.S. Dollar Dominate North America Again?
The final stretch of 2026 is approaching, and North America's major currencies have begun to show a shift in the strength dynamics seen earlier in the year. New expectations of a more aggressive monetary policy stance, particularly in the United States, could be significantly reshaping the outlook for the region. At the same time, this backdrop, combined with potential trade tensions across North America, may become one of the most important drivers of currency performance in the months ahead.


S&P 500 forecast: Stocks extend drop as correction risks grow
US and global equity markets have extended Wednesday’s sell-off, with Wall Street opening lower after a weak handover from Asia and Europe. The deterioration in risk appetite has been spreading across global markets. The dollar was firmer, Treasury yields were holding onto yesterday’s gains, while gold, silver and bitcoin were all under pressure alongside equities and major currencies.

StoneX Europe Ltd may make third party material available on this website which may contain information included but not limited to the conditions of financial markets. The material is for information purposes only and does not contain, and should not be construed as containing, investment advice and/or investment recommendation and/or an investment research and/or an offer of or solicitation for any transactions in financial instruments; any decision to enter into a specific transaction shall be made by the client following an assessment by him/her of their situation.
StoneX Europe Ltd makes no representation or warranty and assumes no liability as to the accuracy or completeness of the information provided, nor any loss arising from any investment based on a recommendation, forecast or other information supplied. You should always seek independent advice as to your suitability to speculate in any related markets and your ability to assume the associated risks, if you are at all unsure. We are not under any obligation to update any such material. Any opinion made may be personal to the author and may not reflect the opinion of StoneX Europe Ltd.