


Crude Oil, DXY Outlook: Geopolitical Risks Halt Sell-Offs in the Dollar and Oil
The U.S. Dollar Index, Brent and WTI are rebounding from key support levels and oversold conditions after steep sell-offs. U.S.–Iran tensions, inflation risks and rate expectations remain in focus.
Share this:

Oversold conditions and bullish divergences between price action and momentum indicators are emerging across the U.S. Dollar Index and crude oil charts after their steep sell-offs. Persistent geopolitical tensions, inflation risks, and profit taking opportunities may be contributing to these signals.
With no concrete solutions yet to the U.S.–Iran conflict, concerns remain over supply disruptions, inflation and December rate hike risks. Recent market moves—including rebounds in risk assets and drawdowns in the dollar and oil—may be approaching short-term support as markets await another key catalyst to confirm a broader de escalation.
As discussed in yesterday’s article, the Democratic win could constrain the current administration’s agenda once the new Congress takes office in January. In the meantime, markets are weighing the risk of near-term escalation during the final months of Trump’s current term and Republican control. The scenarios below outline the key levels that could help define the next directional move and any shift in the geopolitical narrative.
DXY Price Outlook: Daily Time Frame – Log Scale
Source: TradingView
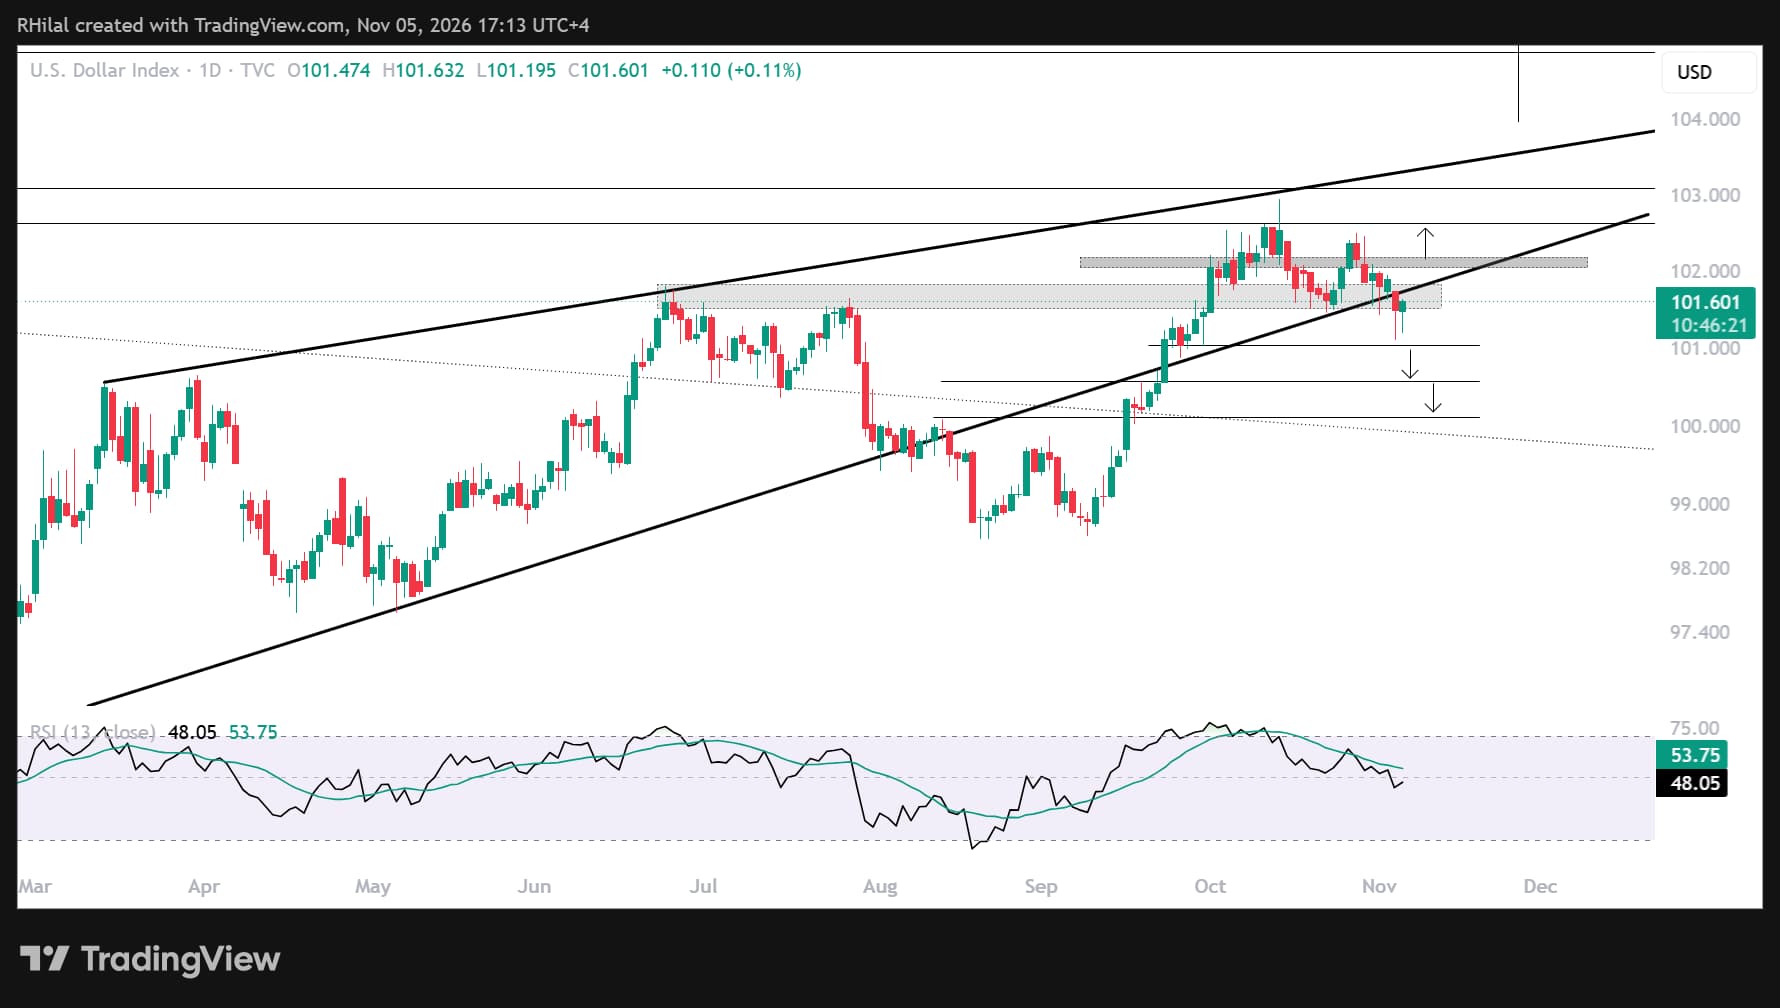
Despite the dollar’s fall toward the previously discussed “cliff’s edge” and the break below its 10-month rising support, price action remains above the 101 level, keeping the bullish outlook valid for now. This level aligns with the 38.2% Fibonacci retracement of the September–October advance. A close below it would expose 100.50 and the psychological 100 level. A sustained move below 100 could confirm a longer-term bearish shift, potentially supporting a recovery in currencies and metals.
On the upside, a move back above 102.20 would reinforce bullish risks and bring resistance at 102.60 and 103.40 into focus. These levels align with the 2026 high and an eight-month rising resistance line, respectively. A final test of this resistance could precede confirmation of a longer-term bullish outlook.
Brent Crude Oil Outlook: Daily Time Frame – Log Scale
Source: TradingView
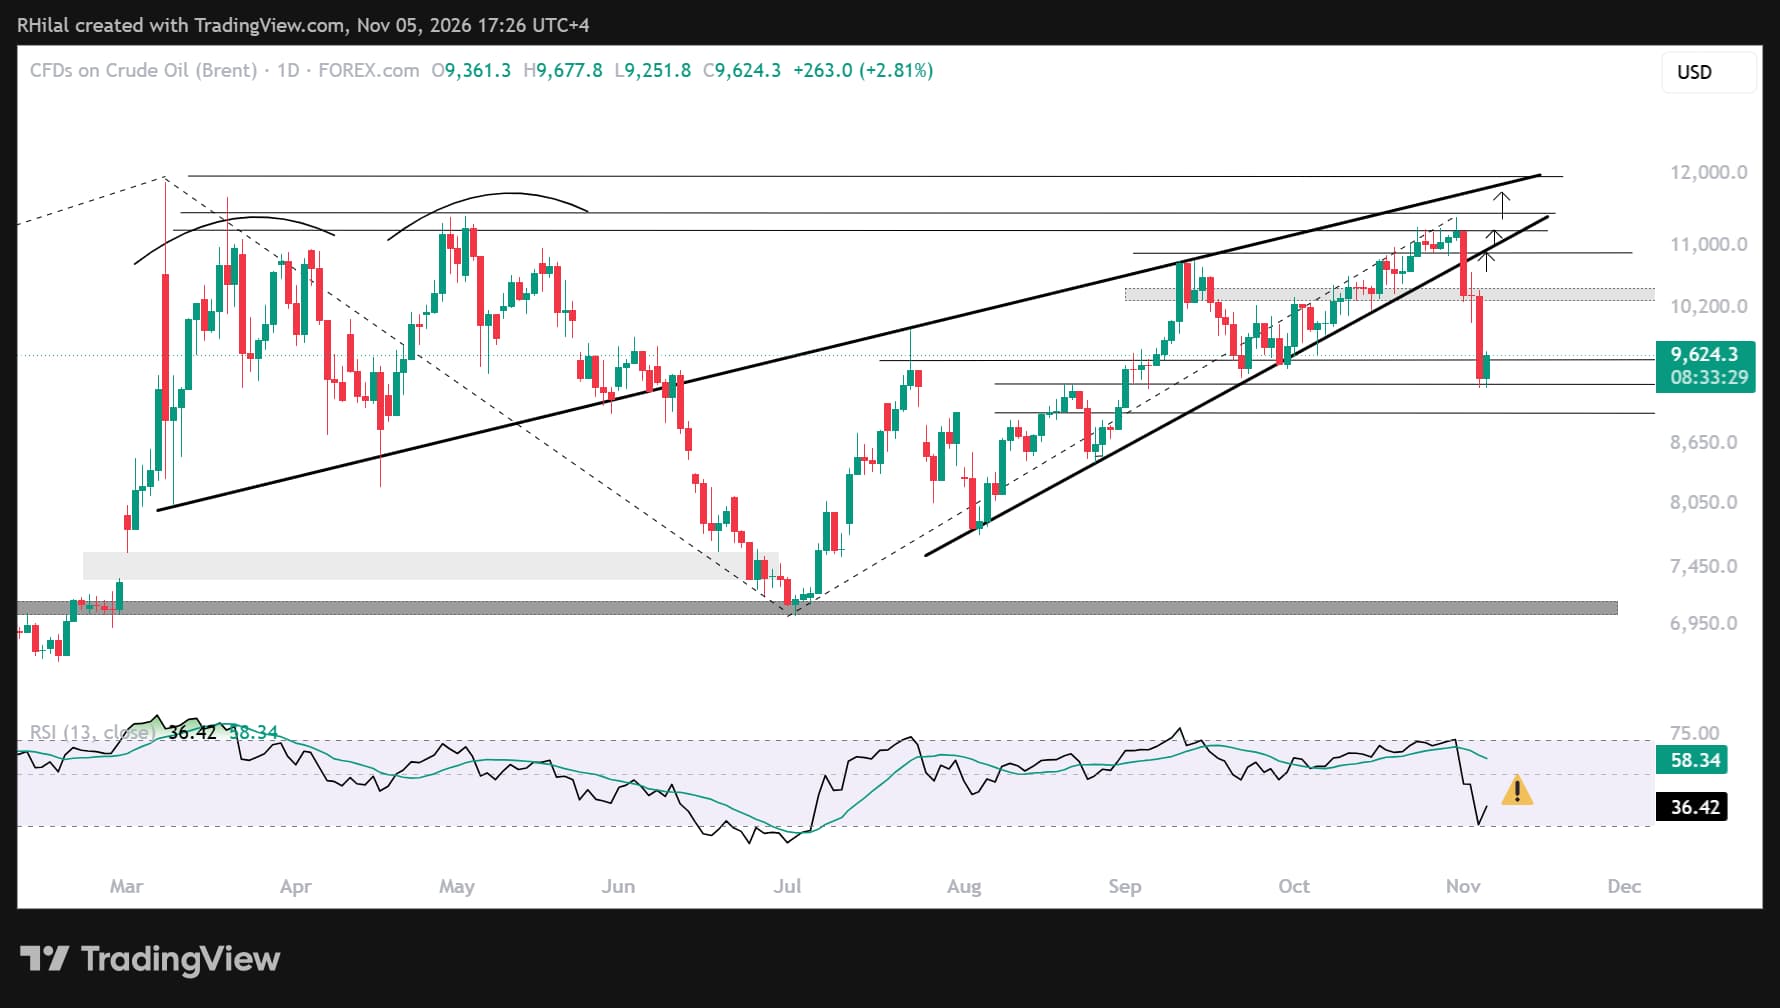
After breaking below the rising support line connecting higher lows since July–August 2026 and the psychological 100 level, Brent is rebounding from key Fibonacci support near 92.50. This level marks the 50% retracement of the July–October advance. Daily momentum has also reached oversold conditions last seen near the July 2026 lows and pre-war levels, bringing near-term rebound risks into focus.
A move back above the psychological 100 level and resistance at 104.40 would bring the July–October uptrend near 109 into focus. This is a key resistance level to clear before bullish continuation toward the yearly highs near 114 and 118 could be confirmed.
On the downside, a break below 92.50 would expose the psychological 90 level, followed by 84 and 76. A sustained move lower would shift the outlook toward a return to pre-war levels.
That bearish scenario would require another catalyst pointing to geopolitical de-escalation. For now, short-term rebound risks remain in focus, both technically and in light of the geopolitical backdrop.
WTI Crude Oil Outlook: Daily Time Frame – Log Scale
Source: TradingView
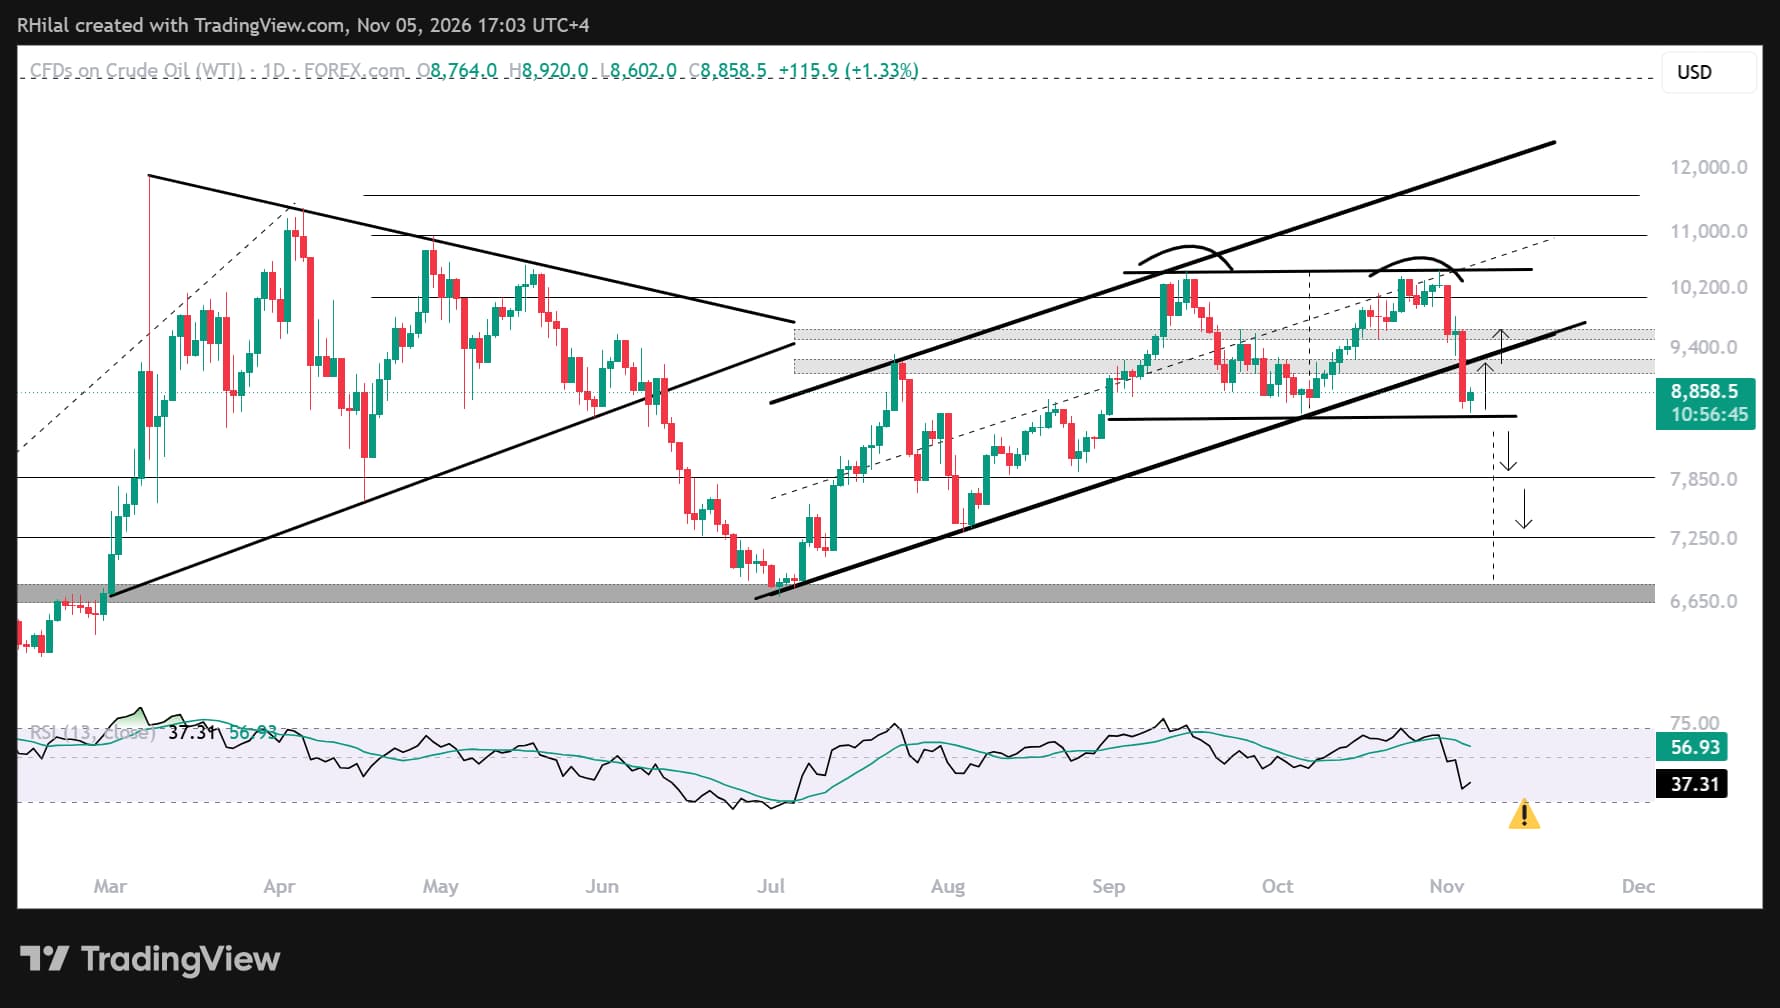
WTI has also broken below the rising support line connecting higher lows since July–August 2026 and the psychological 90 level. Price is testing support near 86, which aligns with the 50% retracement of the July–October advance. A rebound is emerging from this area, alongside daily oversold momentum conditions last seen near the July 2026 lows and pre-war levels, bringing near-term bullish continuation risks into focus.
This support is crucial because it may align with a potential double-top reversal pattern. If confirmed by a break below 86, the pattern could trigger another wave of selling toward the July 2026 lows. The next key support and Fibonacci retracement levels are 79, 72 and 68.
On the upside, a move back above the July–October uptrend and the 92 and 96 levels would reinforce the risk of bullish continuation toward resistance at 104.50.
Markets often need a pause in momentum after a steep trend before that trend can continue—much like climbing a flight of stairs. The current moves may represent this kind of correction. If key levels are not reclaimed, however, broader risk sentiment could come under renewed pressure.
Written by Razan Hilal, CMT
Follow on X: @Rh_waves


The complete CFD trading experience
Award-winning platforms, competitive spreads, low commissions and dedicated support.
We live and breathe the markets and are dedicated to helping traders realise their ambitions as we continue to set the industry bar.
Economic calendar
Web Trader platform
Our sophisticated web-based platform is packed with features.
Related articles
Crude Oil, DXY Outlook: Geopolitical Risks Halt Sell-Offs in the Dollar and Oil
The U.S. Dollar Index, Brent and WTI are rebounding from key support levels and oversold conditions after steep sell-offs. U.S.–Iran tensions, inflation risks and rate expectations remain in focus.

dax-record-high-banks-cyclicals-election-relief-rally-european-stocks
The DAX has surged to fresh record highs as investors continue to rotate into banks, industrials and cyclical stocks following the US midterm elections. Falling bond yields, lower oil prices and improving sentiment have supported risk appetite across Europe, helping the index move decisively above 26,000. The focus now shifts from political relief to whether earnings and macroeconomic data can justify the rally's next leg higher.


Silver's bullish breakout case builds as bond yields retreat
The Democratic blue wave has sent crude and Treasury yields sharply lower, improving the outlook for precious metals. With gold already breaking higher, could silver be next?

StoneX Europe Ltd may make third party material available on this website which may contain information included but not limited to the conditions of financial markets. The material is for information purposes only and does not contain, and should not be construed as containing, investment advice and/or investment recommendation and/or an investment research and/or an offer of or solicitation for any transactions in financial instruments; any decision to enter into a specific transaction shall be made by the client following an assessment by him/her of their situation.
StoneX Europe Ltd makes no representation or warranty and assumes no liability as to the accuracy or completeness of the information provided, nor any loss arising from any investment based on a recommendation, forecast or other information supplied. You should always seek independent advice as to your suitability to speculate in any related markets and your ability to assume the associated risks, if you are at all unsure. We are not under any obligation to update any such material. Any opinion made may be personal to the author and may not reflect the opinion of StoneX Europe Ltd.