



Crude Oil, USD/JPY Outlook: Dollar and Oil Rebound as Hormuz Risks Persist
Crude Oil, USD/JPY Outlook: Crude oil and USD/JPY remain supported as Hormuz tensions keep geopolitical risk premiums elevated. Key technical levels to watch for WTI and USD/JPY.
Share this:

Persistent shifts in sentiment surrounding a potential US-Iran agreement continue to reinforce, rather than eliminate, geopolitical risks. As a result, both crude oil and the US Dollar Index (DXY) have regained ground, with the DXY holding above its 2026 uptrend support near 99.30 and WTI crude remaining firmly above the $70 mark.
The unresolved security framework surrounding the Strait of Hormuz—including future navigation and transit arrangements—remains one of the key obstacles preventing the conflict from transitioning into a durable ceasefire and the full resumption of shipping flows through the strait. Alongside the broader nuclear negotiations that remain central to any lasting resolution, these issues require a long-term political framework before markets can confidently price a sustained geopolitical de-escalation.

As discussed in my previous article, Crude Oil Outlook: What the 1973 Oil Embargo Tells Us About the 2026 Hormuz Crisis, the current environment may resemble historical episodes such as the 1973 oil embargo, when geopolitical uncertainty kept energy risk premiums elevated until durable security and political frameworks were established, supporting decades of stability in global energy markets. Similar conditions have yet to emerge in the 2026 Strait of Hormuz conflict.
The recent market reaction continues to reinforce this intermarket framework:
- The Dow Jones was the first major index to rally to fresh record highs before broader equity markets followed, while simultaneously testing a major higher-timeframe resistance zone. Dow Jones Outlook
- The US Dollar Index (DXY) corrected only to its 2026 uptrend support near 99.30, maintaining its broader bullish structure. DXY Outlook
- WTI and Brent crude oil continue to hold above their respective geopolitical risk premium zones near $66 and $70, suggesting markets have yet to fully price a lasting de-escalation.
Markets reward trends far more consistently than geopolitical headlines. Headlines may trigger volatility, but sustained trends require confirmation through price action. Current intermarket relationships continue to favor caution. Equity indices are testing major long-term resistance, Bitcoin remains unable to confirm the broader risk-on move, the US dollar continues to respect its 2026 bullish structure, and USD/JPY remains resilient despite persistent intervention risks. Together, these signals suggest that markets continue to price geopolitical uncertainty, elevated Treasury yields, and expectations for a more hawkish Federal Reserve as the dominant macro narrative.
Crude Oil Price Outlook: Weekly Time Frame – Log Scale
Source: TradingView
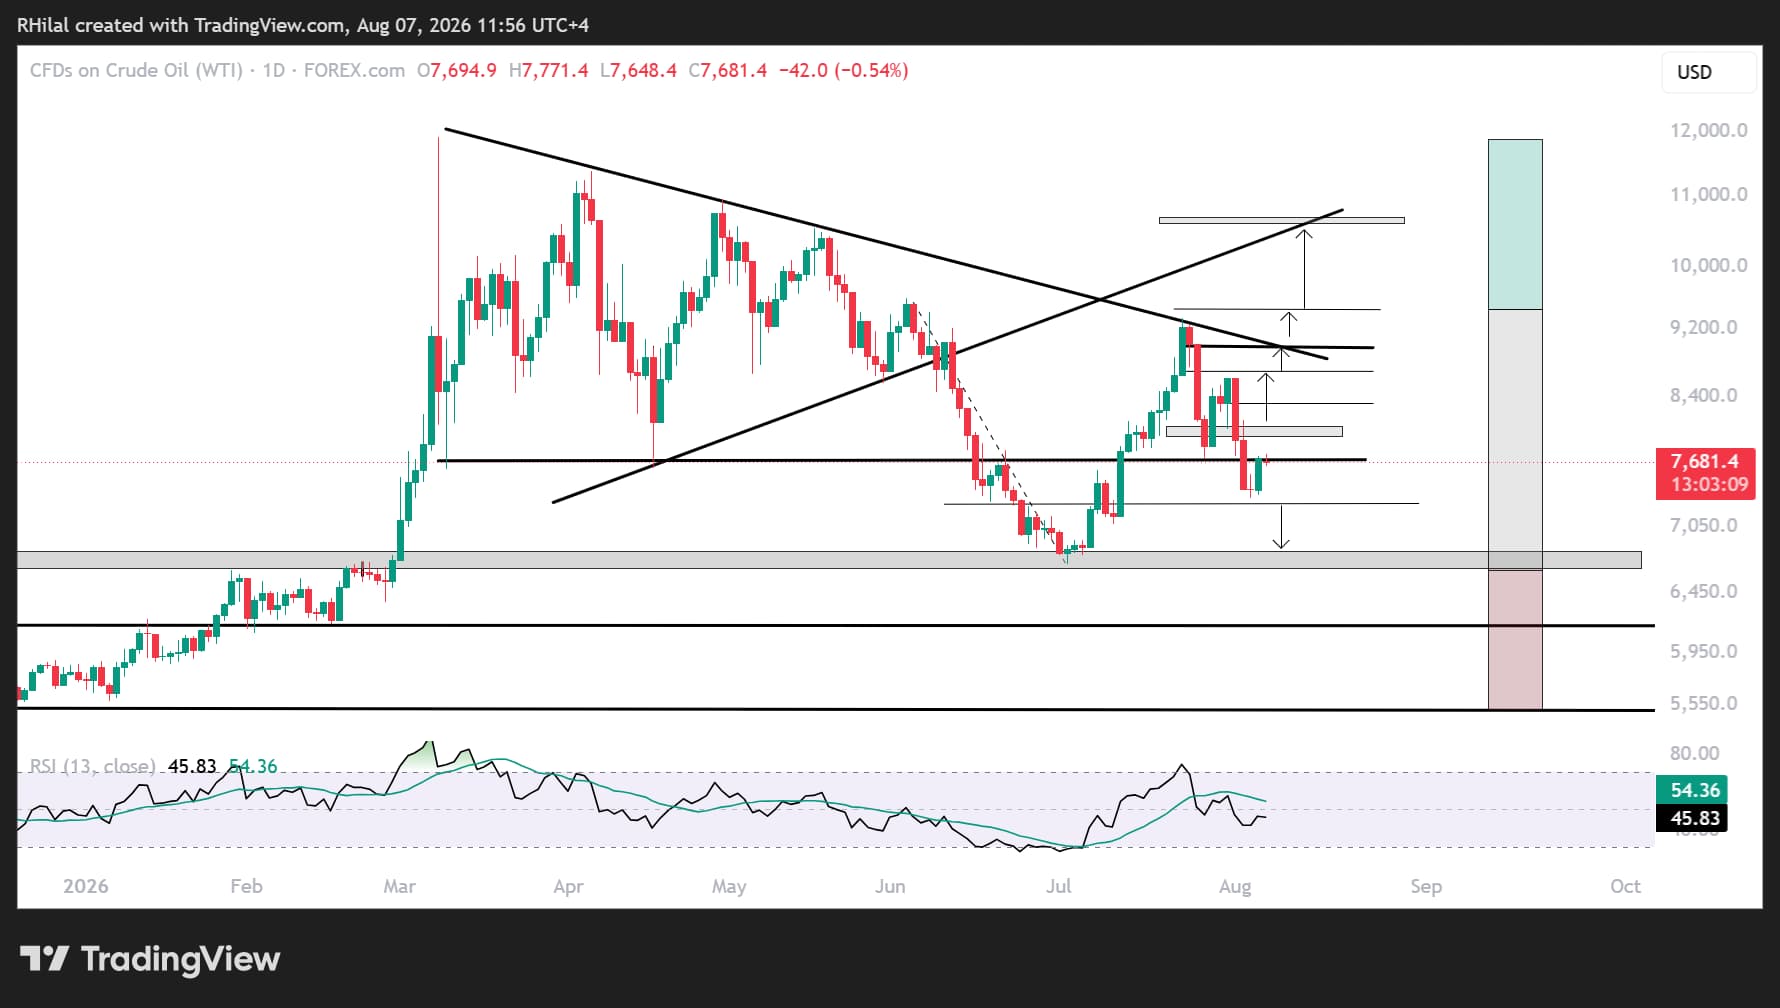
WTI crude oil's latest pullback found support near $72, corresponding with the 78.6% Fibonacci retracement of July's advance. Persistent US-Iran tensions helped stabilize prices above that level, reinforcing the broader bullish structure.
Price action continues to hold above the $70–72 support zone, maintaining the geopolitical risk premium embedded in oil prices. A sustained move above $77—the multi-month support level from March 2026 that has since turned into resistance—would expose the next Fibonacci extension levels derived from July's advance:
- $80.40 – 27.2% Fibonacci extension
- $83.30 – 38.2% Fibonacci extension
- $86.50 – 50% Fibonacci extension
- $89.60 – 61.8% Fibonacci extension, representing a major area where pullback risks may emerge as it aligns with the long-term trendline extending from the lower boundary of the March-June consolidation that preceded July's decline from $93 to $77.
Such a move would likely coincide with persistent tensions surrounding the Strait of Hormuz and continued disruptions to crude oil refining and supply chains. A sustained move into the $86.50–89.60 region would suggest markets are pricing another phase of geopolitical escalation, increasing broader market drawdown risks.
Bearish Scenario
Should WTI crude oil fall back below $72, attention would immediately shift to the $68–66.50 support zone.
This area continues to define the broader escalation versus de-escalation narrative for 2026, having repeatedly acted as both support and resistance since 2019. A weekly close below $66.50 would expose the 2026 lows near $55, signalling that markets are beginning to price a longer-term geopolitical de-escalation scenario. Such a development would likely improve global risk sentiment while easing inflationary pressures.
USD/JPY Outlook: Weekly Time Frame – Log Scale
Source: TradingView
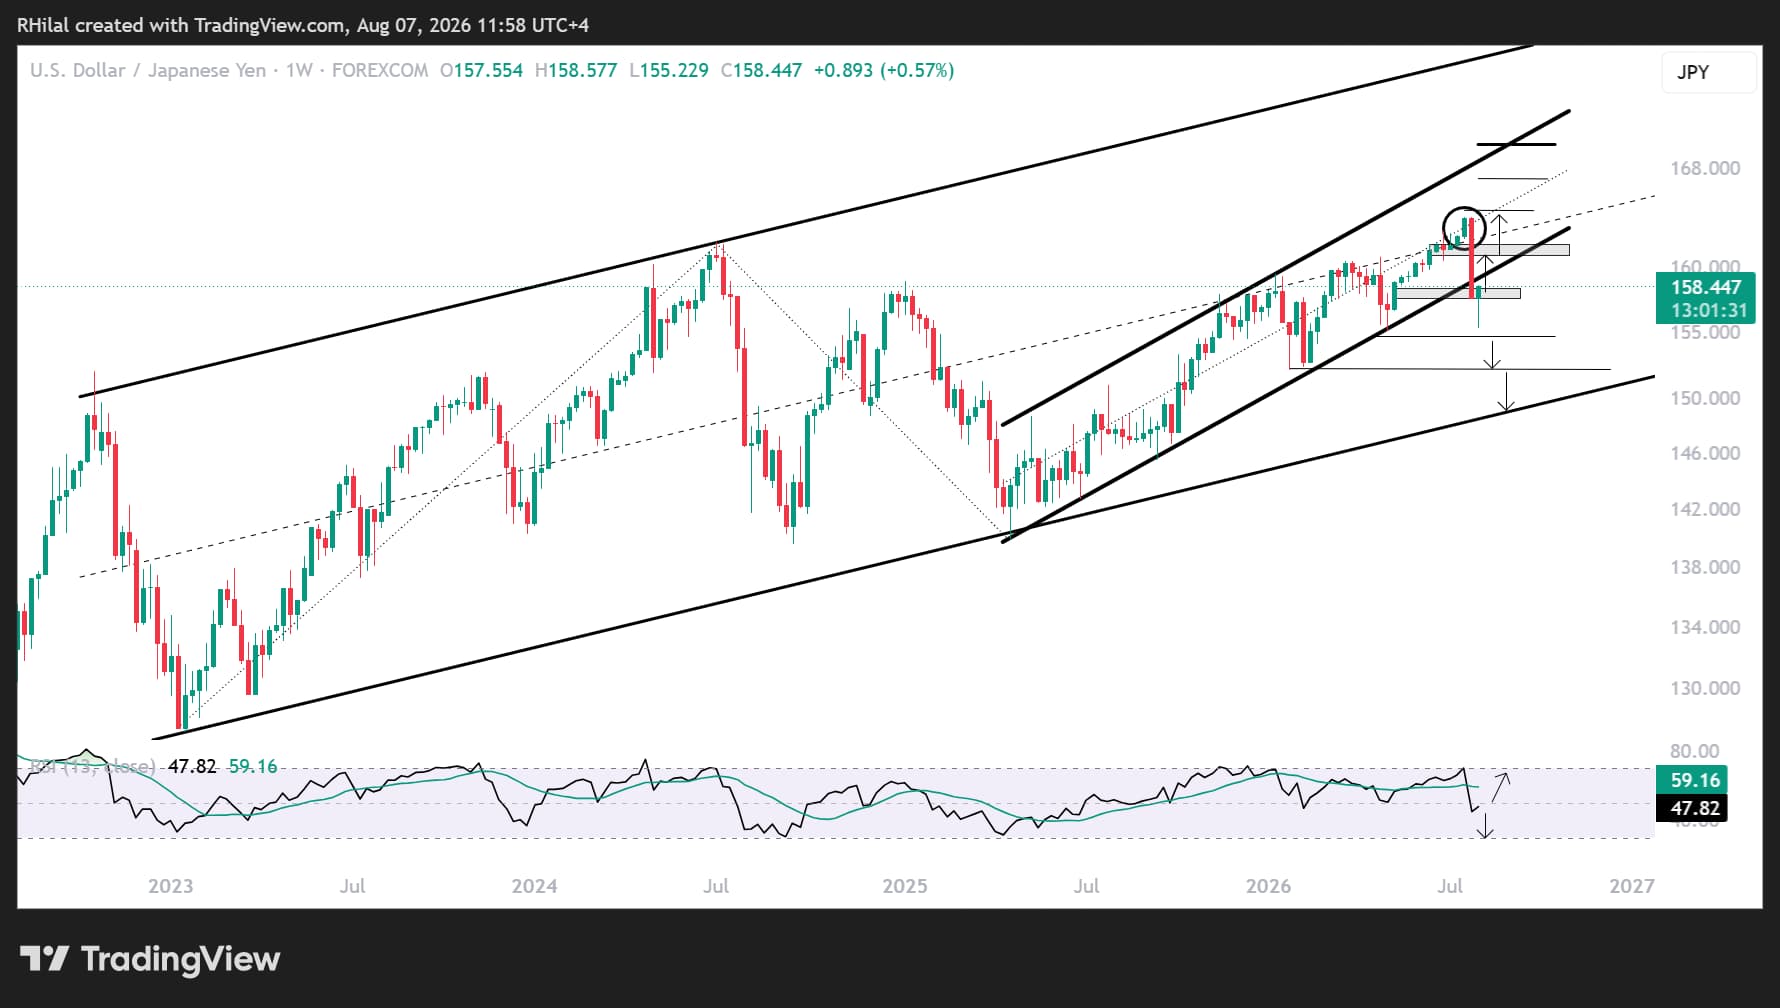
The USD/JPY pullback from the 164.00 confluence zone—a resistance area aligning with both the midpoint of the April 2025–July 2026 channel and the broader 2022–2026 channel—found support near 155.00.
Current support aligns with:
- The 38.2% Fibonacci retracement of the April 2025–July 2026 advance.
- Oversold daily momentum, last seen in 2024.
- A breakdown below the 2025–2026 ascending channel.
Should the current rebound stabilize above 159.50, bullish momentum could return, allowing the pair to retest 161.00, 161.80, and eventually 164.00.
These former support levels may now act as resistance during another test of price levels not seen since the 1980s. A sustained break above 164.00 would expose the upper boundary of the broader channel near 170, following a significant rebuilding of upside momentum.
Conversely, a close below 155.00 would expose the next key support levels at 152.00 and 149.00. This remains a critical region, aligning with the lower boundary of the 2022–2026 channel and defining the longer-term bullish versus bearish outlook for the US dollar—not only against the Japanese yen but across broader financial markets.
The broader outlook continues to favour a bullish bias unless a durable framework governing Middle East shipping routes is established, US Treasury yields begin to decline, and expectations for further Federal Reserve tightening continue to fade.
Written by Razan Hilal, CMT
Follow on X: @Rh_waves
Latest market news




The complete CFD trading experience
Award-winning platforms, competitive spreads, low commissions and dedicated support.
We live and breathe the markets and are dedicated to helping traders realise their ambitions as we continue to set the industry bar.
Economic calendar
Web Trader platform
Our sophisticated web-based platform is packed with features.
Related articles
US Dollar Short-term Outlook: USD Rally on the Line as Midterms, NFP Loom 11 3 2026
DXY is testing pivotal support, with the weekly range breakout likely to determine the next major leg of the trend as key event risk unfolds.

USD/JPY Analysis: Rising U.S. Yields Leave the Yen on the Defensive
As the first week of November progresses, renewed weakness in the Japanese yen is once again becoming evident in the short term. This dynamic can be seen in the recent performance of USD/JPY, which has posted two consecutive bullish sessions and gained more than 0.7%, reflecting a return of buying interest in the dollar while the yen continues to lose momentum.
Australian Dollar Technical Outlook: AUD/USD October Breakout Reverses Toward Critical Support 11 3 2026
Aussie bulls face a critical test of rising trend support, with the October recovery under threat as selling pressure builds into November.
StoneX Europe Ltd may make third party material available on this website which may contain information included but not limited to the conditions of financial markets. The material is for information purposes only and does not contain, and should not be construed as containing, investment advice and/or investment recommendation and/or an investment research and/or an offer of or solicitation for any transactions in financial instruments; any decision to enter into a specific transaction shall be made by the client following an assessment by him/her of their situation.
StoneX Europe Ltd makes no representation or warranty and assumes no liability as to the accuracy or completeness of the information provided, nor any loss arising from any investment based on a recommendation, forecast or other information supplied. You should always seek independent advice as to your suitability to speculate in any related markets and your ability to assume the associated risks, if you are at all unsure. We are not under any obligation to update any such material. Any opinion made may be personal to the author and may not reflect the opinion of StoneX Europe Ltd.