



Crude Oil Weekly Outlook: Holding Ground as Risks Linger
Crude Oil Weekly Outlook: WTI prices are still holding above the 60-mark and near 6-month highs, keeping upside hedging risks alive. Key levels remain in focus.
Share this:

Key Events
• Crude oil is holding gains above the 60 mark and near 6-month highs, keeping upside risks on the table, ahead of Wednesday’s NFP report.
• Crude oil option volume, as per the CME, is tilting slightly towards the bullish side as geopolitical uncertainty lingers.
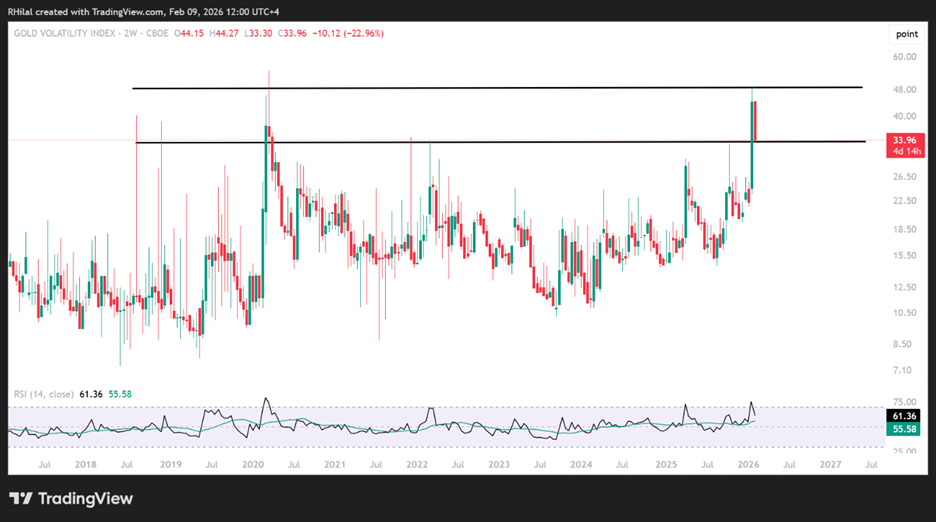
• Gold volatility index aligns with critical support; is another steep move around the corner?
Latest crude inventory reports showed a -3.8m barrel change, the biggest drop since January 2026 and November 2025, in line with the steep winter season. This situation has kept crude prices above the 60 mark, maintaining a neutral to bullish bias on the charts, despite easing tensions in the Middle East over the nuclear talks between the US and Iran.
Geopolitical uncertainty remains in the background of the charts, keeping precious metals also in bullish territory, with gold near 5000 and silver above 80. A chart that stood out to me is the gold volatility index, which pulled back from highs last seen in 2020 to retest a critical zone that was a previous resistance to prices in 2025 and 2022, raising risks for a potential rebound in that volatility.
Gold Volatility Index (GVX) – Monthly Time Frame – Log Scale
Source: Trading view
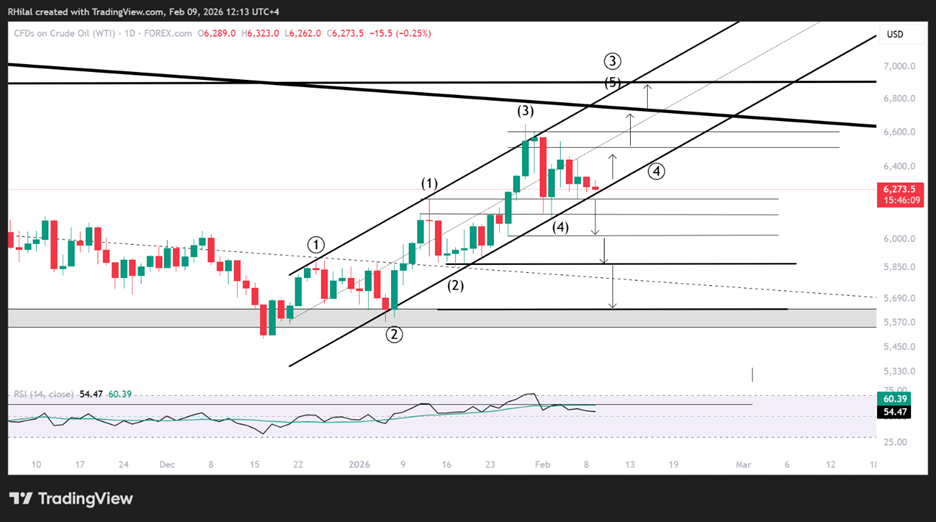
Translating this caution onto the crude oil chart, which is holding a 2026 bullish bias so far, with the illustrated scenarios below.
Crude Oil Outlook: Daily Time Frame – Log Scale
Source: Trading view
From a daily perspective, WTI prices can be seen respecting an up-trending and parallel channel since the lows of 2025, holding a bullish bias for price action across 2026. The latest correction from the 66.50 high coincides with the upper bound of the Dec–Feb channel, and the upper bound of a down-trending channel since Sep 2023, creating a critical resistance zone that can open the way towards a steeper breakthrough in crude prices to the upside, eyeing key levels defined in the weekly chart below.
A short-term resistance level identified on the daily chart before reclaiming the 66 mark is 65. On the downside, a breakdown below the bounds of the channel, below 62.20, can open the path to levels that can still be considered on the bullish end between 61.23 and 60.20. A bearish bias is expected to reassert itself below the 60 mark, targeting 58.70, 56.30, 55, and potentially new lows at 49, last seen in 2020, for dip-buying opportunities.
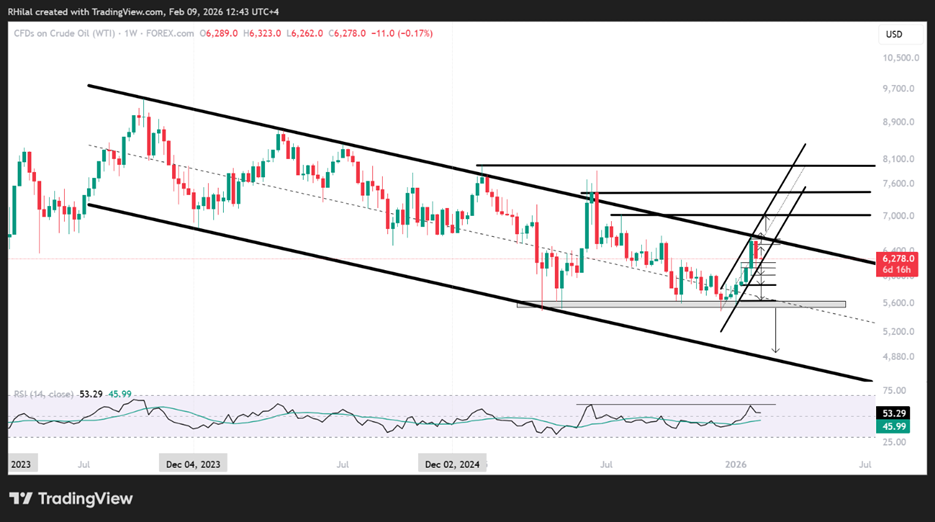
The mentioned levels can be confirmed on the weekly time frame below, as they align with long-term structural patterns on the chart.
Crude Oil: Weekly Time Frame – Log Scale
Source: Trading view
From a weekly angle, the up-trending channel and bias across 2026 span between the mid and upper zones of a channel respected since September 2023, with lower highs and lower lows, marking the previously mentioned 66.50 level as a potential defining barrier between a bullish breakout and bearish continuation. A breakout above this level is expected to extend gains towards 69, 70.40, 74.40, and 80 respectively, defined using the Fibonacci extension tool between the lows of April 2025, the highs of June 2025, and the lows of December 2025.
On the downside, the previously mentioned 55-support, holding price action since the lows of April 2025, aligns with the mid-zone of this channel and can open the way for a steeper drawdown towards the previously mentioned 49 level, which aligns with the lower bound of the respected channel.
Written by Razan Hilal CMT
Follow on X: @Rh_waves
Related tags:
Latest market news




The complete CFD trading experience
Award-winning platforms, competitive spreads, low commissions and dedicated support.
We live and breathe the markets and are dedicated to helping traders realise their ambitions as we continue to set the industry bar.
Economic calendar
Web Trader platform
Our sophisticated web-based platform is packed with features.
Related articles
EUR/USD Q4 2026 Outlook: Euro at a Crossroads as Fed, ECB Tighten 9 25 2026
EUR/USD enters Q4 at a pivotal inflection point as competing Fed-ECB policy paths and persistent inflation risks collide with major technical support.

S&P 500 Forecast: SPX rises as oil prices fall, but treasuries remain at multi-decade highs
U.S. stocks are rising on Friday after a volatile week that saw a surge in Treasury yields ripple through financial markets.


USD/JPY Q4 2026 Outlook: Hawkish Fed Pricing Clashes With Intervention Risk
The year-end tug-of-war is clear: hawkish Fed pricing supports USD/JPY, while intervention risk limits the upside.

StoneX Europe Ltd may make third party material available on this website which may contain information included but not limited to the conditions of financial markets. The material is for information purposes only and does not contain, and should not be construed as containing, investment advice and/or investment recommendation and/or an investment research and/or an offer of or solicitation for any transactions in financial instruments; any decision to enter into a specific transaction shall be made by the client following an assessment by him/her of their situation.
StoneX Europe Ltd makes no representation or warranty and assumes no liability as to the accuracy or completeness of the information provided, nor any loss arising from any investment based on a recommendation, forecast or other information supplied. You should always seek independent advice as to your suitability to speculate in any related markets and your ability to assume the associated risks, if you are at all unsure. We are not under any obligation to update any such material. Any opinion made may be personal to the author and may not reflect the opinion of StoneX Europe Ltd.