



Crude Oil Weekly Outlook: Oversupply Risks Challenge WTI & Brent Despite Hormuz Tensions
Crude Oil Weekly Outlook: Broader crude oil oversupply risks continue to weigh on the recent 10%+ rebound in prices following the latest strikes near the Strait of Hormuz. While geopolitical tensions continue to support risk premiums, technical levels remain well respected and will be key in determining the next major move for WTI and Brent crude.
Share this:

Broader crude oil oversupply risks continue to weigh on the recent 10%+ rebound in prices following the latest strikes near the Strait of Hormuz. While geopolitical tensions continue to support risk premiums, technical levels remain well respected and will be key in determining the next major move for WTI and Brent crude.
Bearish Factors to Watch
- OPEC+ production increases. The latest OPEC+ meeting approved another 188,000 bpd production target increase for August, following similar quota increases in June and July.
- Slowing demand growth, with the IEA projecting demand growth to ease to approximately 1.1 million barrels per day (mb/d).
- Recovery in Gulf production and exports.
- Crude oil inventories returning to positive territory after reaching yearly lows of approximately -8.3 million barrels.
- A breakdown below $69 and $66, a multi-year support and resistance zone that could reinforce the broader bearish outlook.
I mention these levels in the Dily MENA Market Call
Bullish Factors to Watch
- An escalation of strikes around the Strait of Hormuz, reinforcing geopolitical risk premiums.
- Continued attacks on energy infrastructure between Ukraine and Russia.
- A breakout above $78 for WTI and $80 for Brent.
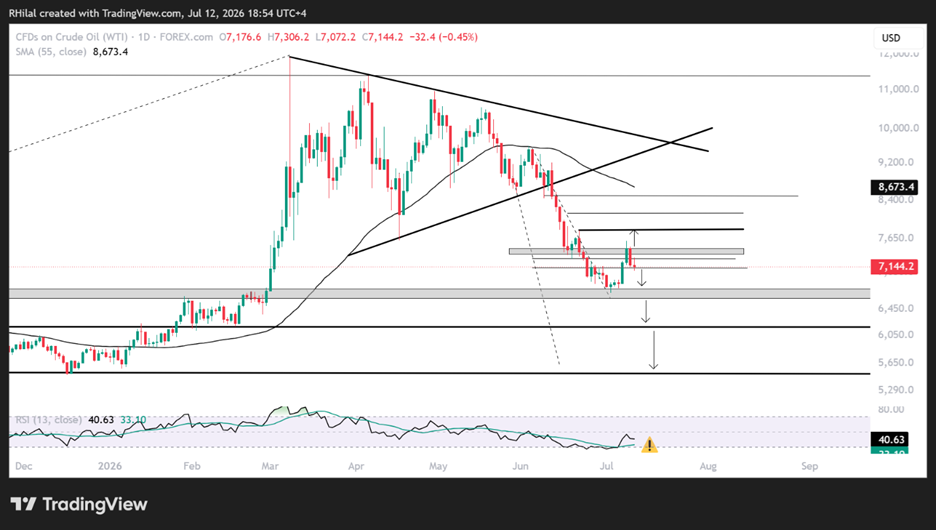
Crude Oil Weekly Outlook: Daily Time Frame – Log scale
Source: Trading view
WTI crude oil's latest 13% rebound from the $66 level stalled near the 23.6%–27.2% Fibonacci retracement of the June–July decline, around $75, before forming a daily bearish engulfing pattern. This rejection reinforces the broader oversupply narrative, following the bearish breakdown from the yearly highs and the bearish consolidation that developed between March and June 2026. As a result, prices are now testing potential short-term support near $71.
A break below $71 would expose $69 and $66.50 once again. This remains a critical technical zone, aligning with:
- Multi-year support dating back to 2019.
- The 78.6% Fibonacci retracement of the 2026 rally.
- Oversold daily momentum conditions last seen in 2025, when crude oil traded near the $55 low.
The broader bearish trend remains intact following the breakdown below the March–June consolidation range.
If $66 fails to hold, downside pressure could initially target the $61 support area before any meaningful rebound develops. A decisive break below $61 would strengthen the case for an eventual move toward the $55 objective outlined in my second-half outlook.
Although oversold conditions could trigger a short-term technical recovery, the medium-term trend remains biased to the downside unless a new geopolitical catalyst materially changes the global supply outlook.
Key resistance levels
Should the rebound extend above $75, the following resistance levels will be closely monitored:
- $78 – 38.2% Fibonacci retracement (high-probability pullback zone).
- $81.20 – 50% Fibonacci retracement.
- $84.80–$85.00 – 61.8% Fibonacci retracement (high-probability pullback zone).
Written by Razan Hilal, CMT
Follow on X: @Rh_waves



The complete CFD trading experience
Award-winning platforms, competitive spreads, low commissions and dedicated support.
We live and breathe the markets and are dedicated to helping traders realise their ambitions as we continue to set the industry bar.
Economic calendar
Web Trader platform
Our sophisticated web-based platform is packed with features.
Related articles

USD/JPY weekly outlook: Quarter turn scrambles rates regime
USD/JPY’s tight relationship with front-end US rates broke down sharply last week, but quarter-turn flows and positioning suggest the disconnect may prove temporary.


Dow Jones Forecast: DJIA rises after weaker jobs data
U.S. stocks are rising after weaker-than-expected U.S. jobs data saw markets rein in rate hike expectations.


What Stretched 10-Year Yields Mean for Major Currency Pairs in Q4
U.S. 10-year Treasury yields are nearing a long-term resistance zone with overbought RSI readings, raising near-term pullback risk for the dollar.
StoneX Europe Ltd may make third party material available on this website which may contain information included but not limited to the conditions of financial markets. The material is for information purposes only and does not contain, and should not be construed as containing, investment advice and/or investment recommendation and/or an investment research and/or an offer of or solicitation for any transactions in financial instruments; any decision to enter into a specific transaction shall be made by the client following an assessment by him/her of their situation.
StoneX Europe Ltd makes no representation or warranty and assumes no liability as to the accuracy or completeness of the information provided, nor any loss arising from any investment based on a recommendation, forecast or other information supplied. You should always seek independent advice as to your suitability to speculate in any related markets and your ability to assume the associated risks, if you are at all unsure. We are not under any obligation to update any such material. Any opinion made may be personal to the author and may not reflect the opinion of StoneX Europe Ltd.