





Crude Oil Weekly Outlook: Trump Deadlines, OPEC Decisions, and Geopolitics
Crude Oil Weekly Outlook: Despite headlines pointing to depressed oil prices, market jitters surrounding Trump’s tariff tactics, and growing concerns over U.S. debt, WTI remains resilient, holding firmly above the key psychological level of $60. What are the critical levels to watch this week?
Share this:

Key Events to Watch
- Trump-driven market sentiment: U.S. debt concerns, GDP outlook, and tariff negotiation tactics
- Geopolitical risks: Israel, Iran, and Russia
- OPEC supply cuts unwinding—yet oil still holds above $55
- NVIDIA earnings on Wednesday
Despite headlines citing depressed oil prices, shaken market confidence from Trump tariffs, and U.S. debt concerns, WTI is still holding firm above the $60 psychological level. Last week ended with a 50% Eurozone tariff market slump, and this week opened with a tariff delay to allow negotiations to proceed—clarifying Trump’s tariff negotiation tactics between setting the bar too high and then extending deadlines for reasonable talks to take place.
The dollar seems to be taking the major hit, aligning major currency and commodity pairs on a bullish track. Equities are holding their pullbacks from bullish territories, with the Nasdaq in the lead and eyes on AI projects and NVIDIA earnings this Wednesday.
Oil’s rebound reflects priced-in oversupply fears from OPEC’s unwinding and trade headlines. New market drivers include Trump’s evolving policies, revised tariff timelines, and persistent debt concerns, all weighing on sentiment as the quiet summer season begins.
Geopolitical risks also loom: Democratic concerns over U.S.–Gulf AI deals potentially leaking to China or Russia could trigger bearish reactions, while the Israel–Iran conflict may fuel upside risk if oil supply is affected. For now, attention is on summer demand and the final U.S. GDP reading due Thursday.
With the dollar at its lowest since 2023, what are the key levels to watch for crude oil?
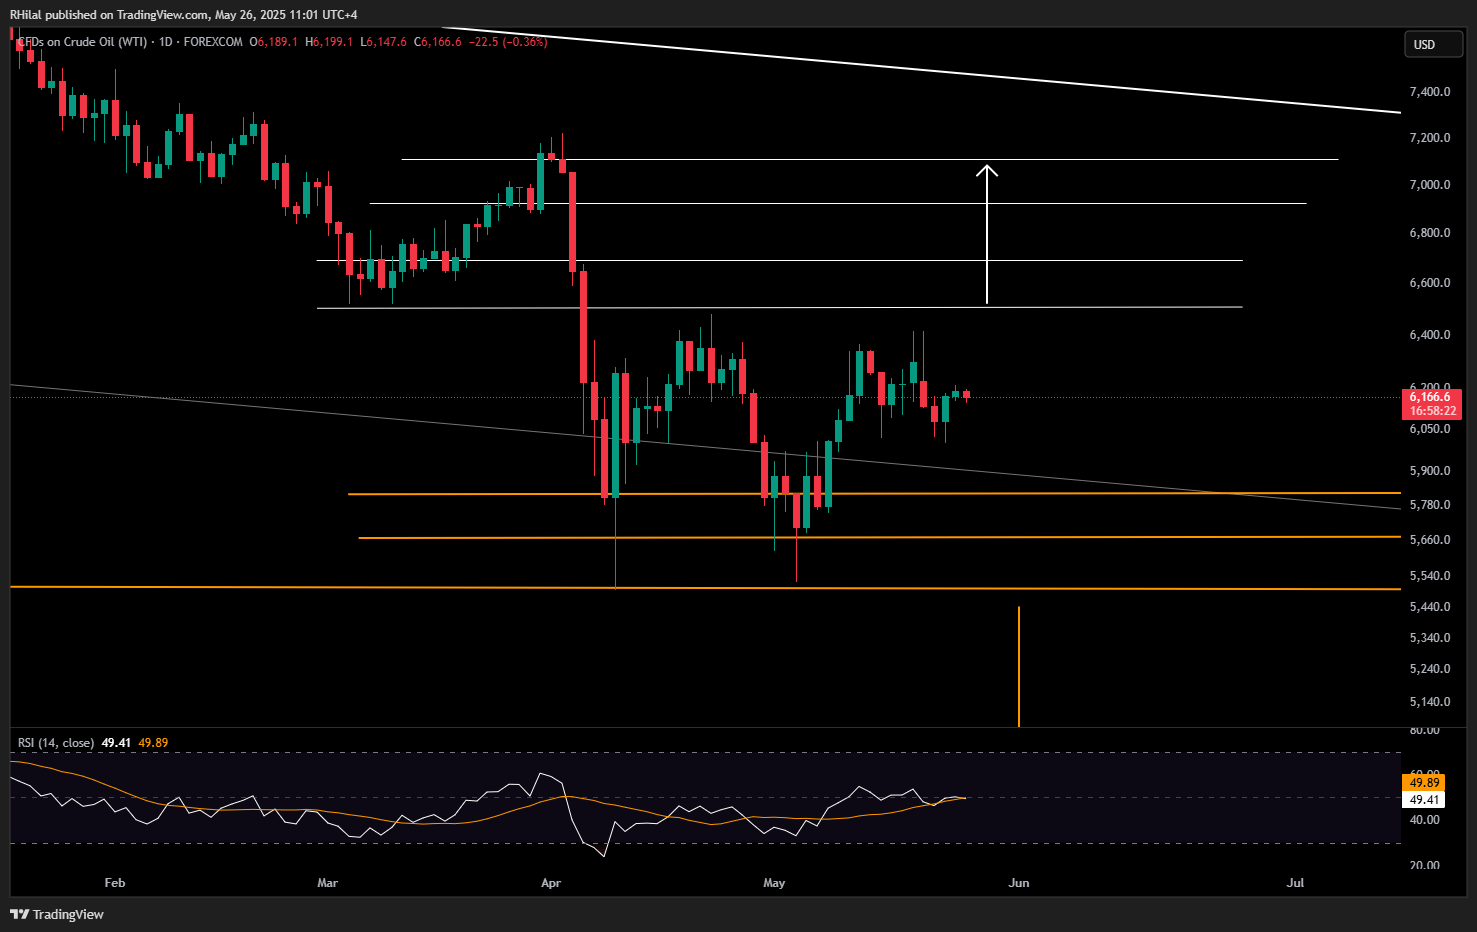
Crude Oil Weekly Outlook: 3-Day Time Frame – Log Scale
Source: Tradingview
Crude oil remains locked in a resilient sideways range, with strong support between $55 and $58, and a key resistance zone between $63 and $65. Momentum indicators are mixed:
-
Daily RSI remains neutral, allowing for both bullish and bearish scenarios.
-
Weekly SI shows a clean bounce from 2020 extremes, suggesting underlying bullish potential.
Scenarios to Watch
Bullish Scenario:
A sustained move above $63.80–$65 could pave the way for gains toward $66.90, $69.20, and $71.
Bearish Scenario:
A decisive break below $58 would expose downside risk toward $56.70 and $55. In the case of extreme market turbulence, further losses toward $49 remain possible—potentially setting up for a new long-term bullish positioning.
Written by Razan Hilal, CMT
Follow on X: @Rh_waves
Related tags:
Latest market news




The complete CFD trading experience
Award-winning platforms, competitive spreads, low commissions and dedicated support.
We live and breathe the markets and are dedicated to helping traders realise their ambitions as we continue to set the industry bar.
Economic calendar
Web Trader platform
Our sophisticated web-based platform is packed with features.
Related articles

Crude Oil Weekly Outlook: U.S.–Iran Deal Hopes Ahead of Elections?
Crude oil weekly outlook: U.S.–Iran negotiations may be moving closer to a breakthrough as the U.S. midterm elections approach on Tuesday, bringing key resistance levels on crude oil charts into focus.
Crude Oil Weekly Outlook: Elections Test Brent–WTI Resistance Levels
Crude Oil Weekly Outlook: Brent–WTI spread tests long-term resistance as monthly RSI reaches overbought territory and key elections approach. Brent and WTI levels and risks ahead.

Crude Oil Analysis: WTI Approaches $100 Amid Growing Supply Risks
Recent trading sessions continue to highlight a strong bullish bias across the oil market. As reflected in the performance of WTI crude, prices have maintained a solid recovery since the beginning of October and are now up more than 12% since October 8, a development that continues to underline the strength of demand in the short term.

StoneX Europe Ltd may make third party material available on this website which may contain information included but not limited to the conditions of financial markets. The material is for information purposes only and does not contain, and should not be construed as containing, investment advice and/or investment recommendation and/or an investment research and/or an offer of or solicitation for any transactions in financial instruments; any decision to enter into a specific transaction shall be made by the client following an assessment by him/her of their situation.
StoneX Europe Ltd makes no representation or warranty and assumes no liability as to the accuracy or completeness of the information provided, nor any loss arising from any investment based on a recommendation, forecast or other information supplied. You should always seek independent advice as to your suitability to speculate in any related markets and your ability to assume the associated risks, if you are at all unsure. We are not under any obligation to update any such material. Any opinion made may be personal to the author and may not reflect the opinion of StoneX Europe Ltd.