



DAX Rallies Toward 24K on Tariff Cuts, Momentum Stretched
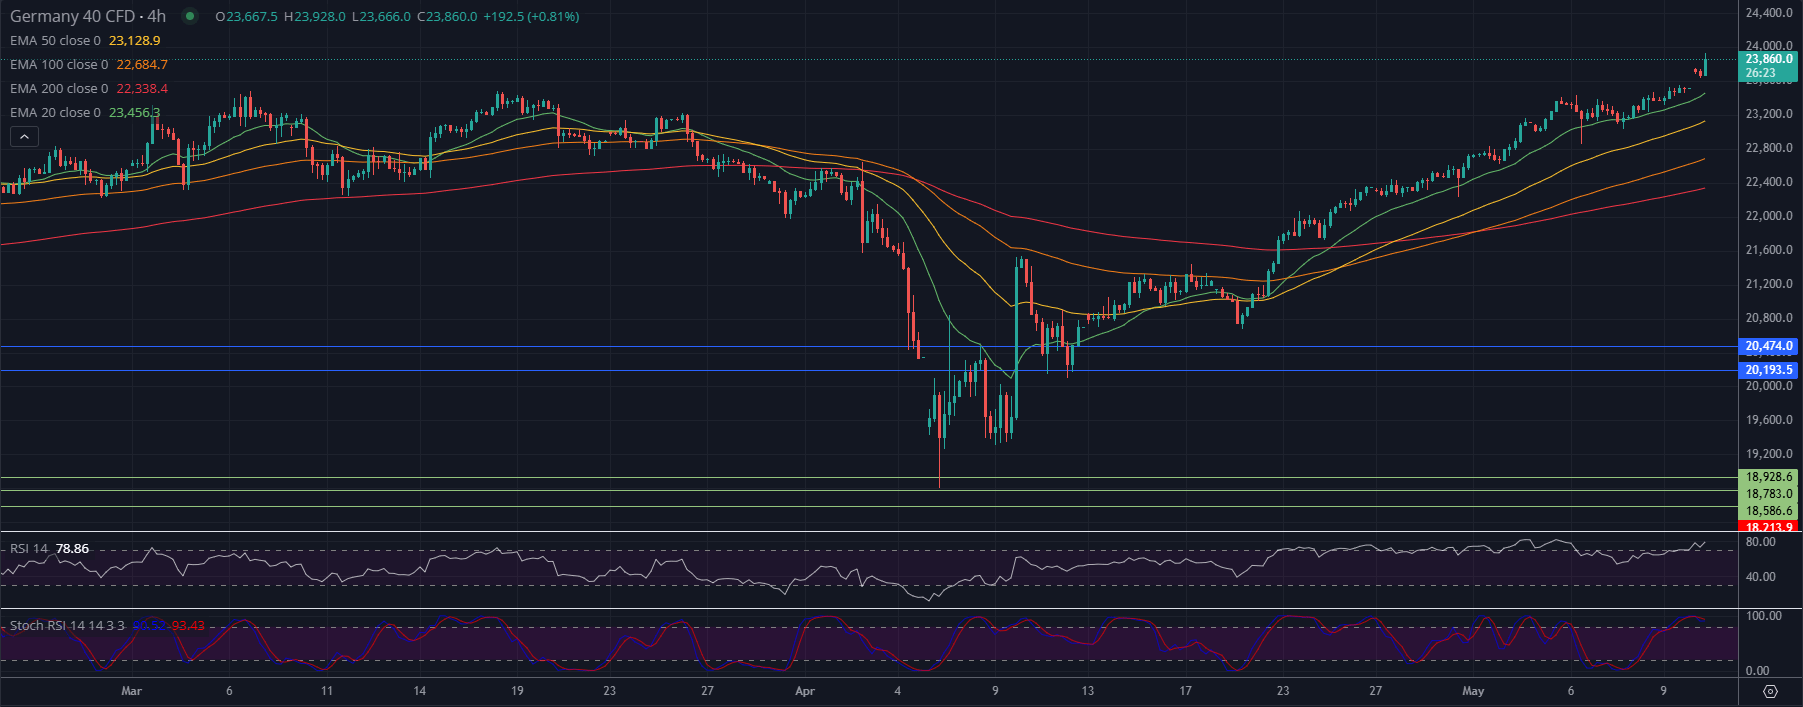
DAX breaks higher to 23,860, fueled by US-China tariff cuts and strong risk sentiment. With the RSI at 78.86 and Stochastic RSI overbought, the rally may face short-term exhaustion near the 24,000 resistance. Still, price remains above all EMAs, confirming bullish momentum. Gold dips, oil steadies, and global markets cheer trade progress. As long as 23,450 holds, bulls control the trend. Watch for consolidation before next leg higher.
Share this:

🌍 Global Markets & Trade
- Markets rallied Monday on optimism over US-China trade talks. The US is said to lower Chinese Tariffs to 30% for 90 days. China will lower Tariffs to 10%. Officials called the Geneva meeting “constructive” with “substantial progress” reported, boosting risk sentiment.
- S&P 500 and Nasdaq futures rose over 1%; Chinese equities gained despite weak inflation data.
- Dollar strengthened vs. safe havens; gold fell 1.7% as risk appetite returned.
- Oil prices edged up, supported by trade optimism, though capped by OPEC+ supply plans.
- Fed rate cut expectations decreased: only 17% chance seen for June, 59% for July.
🇺🇸 US Productivity
- Q1 productivity (ex-agriculture) fell 0.8%, the first decline since Q2 2022.
- Output dipped slightly, while hours worked rose 0.6%.
- Industrial sector was the bright spot (+4.5%), driven by strong aircraft production.
- Productivity grew 1.4% YoY but the drop may pressure corporate margins and revive rate cut talk.
🛢️ Energy Markets
- Oil volatility remains high:
- Hit a 4-year low of $55.30 last week.
- Rebounded above $60, but slipped midweek (~−3%) on fading trade optimism.
- US crude inventories fell by 2.03M barrels, but failed to boost prices meaningfully.
- Sustainable oil recovery hinges on de-escalation in trade tensions and improved economic sentiment.
- Natural gas prices rebound:
- After halving from €60 to €30/MWh (Feb–Apr), prices rose in May.
- Drivers:
- Trade de-escalation hopes,
- EU gas storage at just 42% (vs. 51% avg),
- EU commitment to end Russian gas imports by 2027, with new bans starting 2026.
🇩🇪 DAX Technical Overview (4H Chart)
- DAX trades at 23,860 (+0.81%) after China’s tariff cuts to 10–30% for 90 days.
- Breakout above key resistance confirms strong bullish momentum from April lows.
🔧 Technical Setup:
- Price above all EMAs (bullishly aligned); 20 EMA at 23,456 holds as dynamic support.
- RSI at 78.86 and Stochastic RSI in deep overbought zone → signs of short-term overheating.
🔑 Levels:
- Resistance:
- 🔺 24,000 (psychological)
- 🔺 24,300–24,500 (extended target)
- Support:
- 🟢 23,450–23,400 (20 EMA zone)
- 🟡 23,100–22,900 (prior structure)
- 🔵 20,474/20,193 (long-term base)
📈 Outlook:
- Bias: Bullish, but due for a short-term pullback or consolidation.
- Holding above 23,450 keeps bulls in control; watch 24,000 for potential pause or breakout continuation.
Related tags:
Latest market news




The complete CFD trading experience
Award-winning platforms, competitive spreads, low commissions and dedicated support.
We live and breathe the markets and are dedicated to helping traders realise their ambitions as we continue to set the industry bar.
Economic calendar
Web Trader platform
Our sophisticated web-based platform is packed with features.
Related articles
Swiss Franc Short-term Outlook: USD/CHF Selloff Nears Critical Support Ahead of NFP 11 4 2026
USD/CHF bears are closing in on critical trend support, with the next reaction likely to determine whether the October decline has further to run.

US Midterm Fallout: What Does the “Blue Tsunami” Mean for the S&P 500?
Democrats made sweeping gains in the US midterm elections, winning control of both the House and Senate - what does it mean for the S&P 500 and the AI trade?

USD/CAD Forecast: Canadian Dollar Gains Ground After U.S. Midterm Elections
The trading week continues to unfold and the recovery in the Canadian dollar has once again become a relevant theme in the short term. This can be clearly seen in the recent performance of USD/CAD, which is down nearly 0.4% during the session, reflecting a consistent recovery in the CAD against the U.S. dollar.
StoneX Europe Ltd may make third party material available on this website which may contain information included but not limited to the conditions of financial markets. The material is for information purposes only and does not contain, and should not be construed as containing, investment advice and/or investment recommendation and/or an investment research and/or an offer of or solicitation for any transactions in financial instruments; any decision to enter into a specific transaction shall be made by the client following an assessment by him/her of their situation.
StoneX Europe Ltd makes no representation or warranty and assumes no liability as to the accuracy or completeness of the information provided, nor any loss arising from any investment based on a recommendation, forecast or other information supplied. You should always seek independent advice as to your suitability to speculate in any related markets and your ability to assume the associated risks, if you are at all unsure. We are not under any obligation to update any such material. Any opinion made may be personal to the author and may not reflect the opinion of StoneX Europe Ltd.