


DAX Recovery Tested at Key 25,500 Resistance Zone
The DAX has recovered sharply from its September correction, climbing back above 25,000 after successfully holding long-term support near the 200-day moving average. While the broader bull trend remains intact, the index is now approaching one of the most important technical resistance zones on the chart. A break above 25,500–25,600 would strengthen the bullish case and open the door toward 26,000 and eventually the August record high. Failure at this level would suggest the recent move remains a corrective rebound rather than the start of a new leg higher.
Share this:

DAX 40 Technical Analysis: A Market at a Critical Turning Point
The DAX 40 reached a record high of 26,618.74 in late August, after which the index pulled back sharply, falling to 24,939 last week and recovering toward the 25,500 area.
That recovery has improved the technical picture, but it has not yet settled the bigger question: is the DAX starting a new leg higher, or is this simply a bounce within a larger correction?
For now, what we have on the charts leans bullish, but the way the DAX moves through the 25,500 area will be the telltale sign.
Monthly Trend: The Bigger Picture Remains Bullish
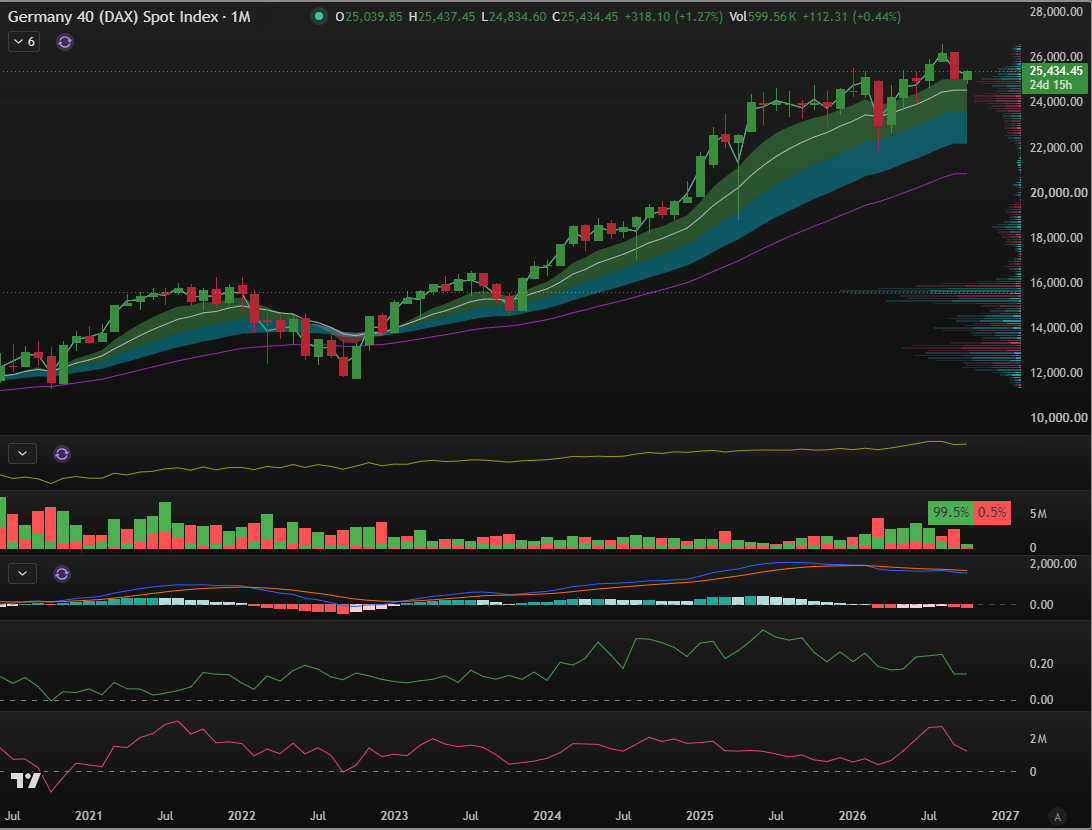
Looking at the monthly chart puts the recent weakness into perspective. Despite the August–October correction on smaller timeframes, the DAX remains within a much larger long-term uptrend when we look at the Monthly trend.
Yes, the decline from 26,618 to around 24,939 was significant, but it has not fundamentally damaged the broader bullish structure. The index remains well above the major levels that would need to break before a genuine long-term trend reversal could be considered.
This distinction matters because the DAX does not currently look like a market that has entered a structural bear market. It looks more like a market that has paused and is working through a sizeable correction after a strong advance.
The long-term trend therefore remains the foundation of the bullish case.
Weekly Trend: A Correction Still Needs to Be Repaired
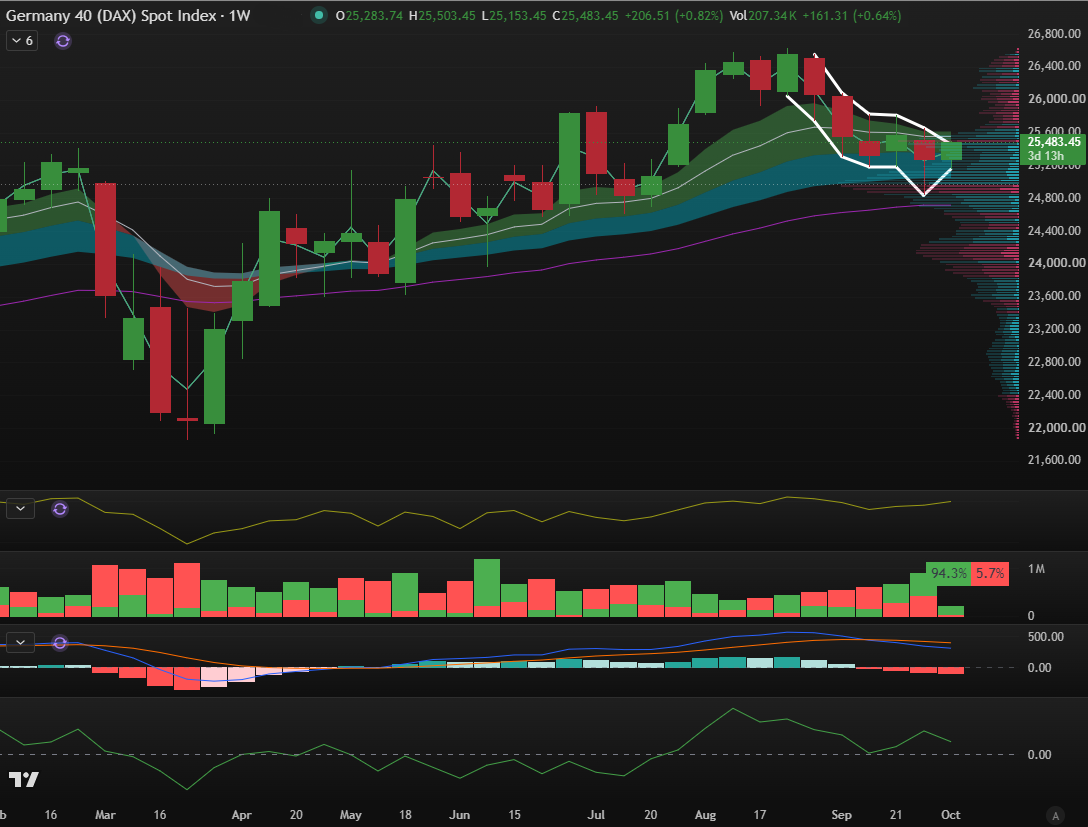
The weekly chart tells a more cautious story. After reaching its August high, the DAX began forming lower highs and lower lows, creating a clear corrective phase.
The rebound from 24,939 is encouraging, but the weekly trend has not completely turned around yet. The index needs to reclaim the 25,500–25,600 region to convincingly break the sequence of lower highs created during the correction.
Until then, the best description is a long-term bull market undergoing a medium-term correction.
Daily Trend: Buyers Are Starting to Regain Control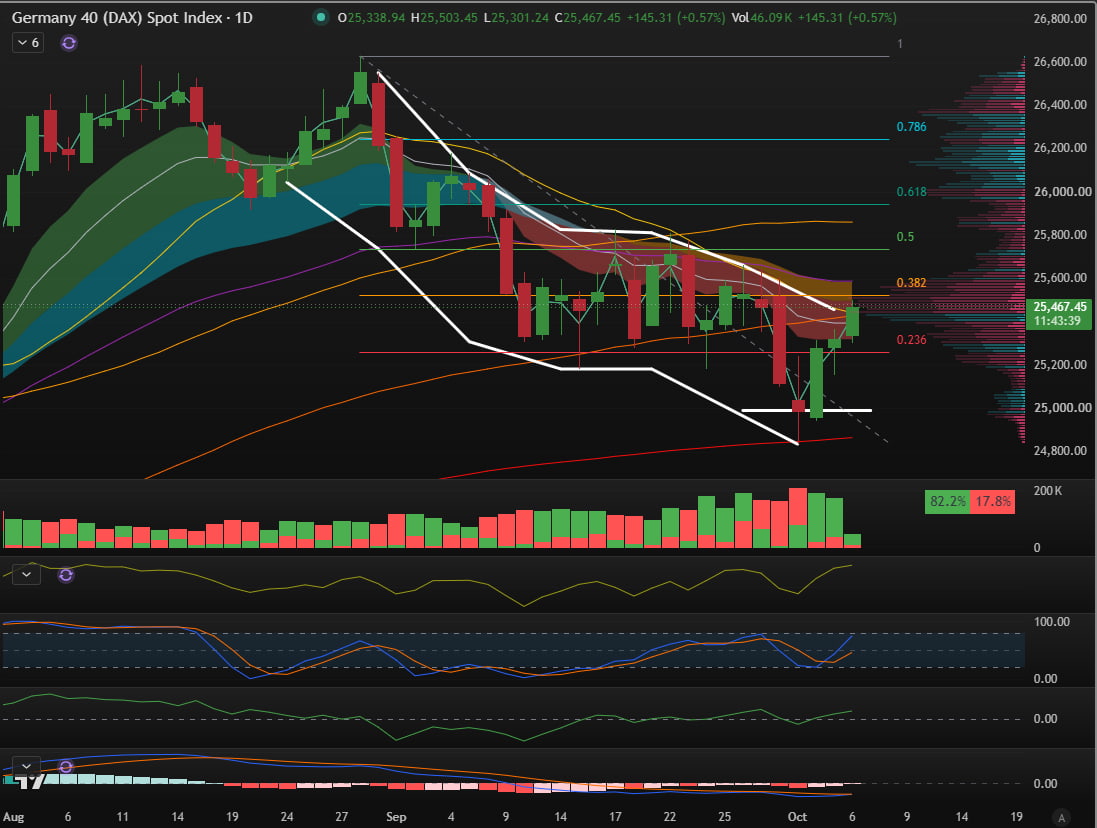
The daily chart is where the picture has improved more noticeably.
The DAX has recovered above 25,000 after bouncing off the 200 EMA and is now trading above its shorter-term 100 EMA and 50 EMA. The 50-day average sits around 25,443, while the 100-day averages isa above the current price at 25,861.60.
This clustering is important. It creates a relatively strong support area between roughly 25,350 and 25,450.
But immediately above these levels lies the Weekly high as seen with the descending white trendline at 25,460 as well as the 100 and 20 moving averages, around 25,430–25,500. These are the levels that matter most right now.
If the DAX can move with decisiveness above 25,500 and stay there, only then would the recent recovery start to look much more like the beginning of a new bullish phase.
The 200-Day Moving Average Is the Line in the Sand
The most important technical level on the Daily chart is currently the 200-day moving average at 24,860 and the current levels around 25,400 and 24,600.
This is where several technical indicators are bundled together and form a strong resistance level.
That creates a clear decision zone around 25,400–25,600.
A clean break above this area could be significant as it would indicate that buyers have not only brushed off the recent losses but are also willing to push through a major long-term resistance level.
A rejection, on the other hand, would delay a push higher and could renew downside pressure.
Fibonacci Levels Point to the Next Targets
The Fibonacci retracement of the move from 26,618.74 down to 24,939.35 gives us a useful roadmap.
The 23.6% retracement sits around 25,336, the 38.2% level around 25,582, the 50% level around 25,779 and the 61.8% level around 25,976.
These levels fit neatly with the price structure.
The first important support zone is around 25,330–25,400. Above that, the market has to deal with 25,480–25,600. If that resistance is overcome, the next major targets are around 25,780 and 25,980.
Beyond those levels, 26,260 becomes important, followed by the August record high at 26,619.
Volume: The Bulls Still Need to Prove Themselves
Volume is where the bullish argument becomes less straightforward.
The sell-off through 25,000 was accompanied by relatively strong participation suggesting that sellers were genuinely active. The subsequent recovery, however, has not yet produced the same level of conviction from buyers but is gaining traction.
That means the DAX is trying to recover, but the market has not yet demonstrated overwhelming accumulation and will perhaps be seen this week.
Therefore, a move above 25,500 accompanied by significantly stronger volume would show that momentum is gaining due to enhanced participation. It would provide much better evidence that institutions are buying the breakout rather than simply covering short positions or trading a temporary rebound.
Trade Setup: Patience Improves the Risk/Reward
From a trading perspective, the current location is less attractive than it might initially appear.
Buying directly into 25,500 means buying into a major resistance zone. A better risk/reward setup could be a pullback toward 25,400–25,450, where the short-term moving averages and previous price structure provide support.
However, a fall below these levels and back below the 0.236 Fib retracement would invalidate that setup. The first sign of strong momentum would be 25,780 at the 0.5 Fib retracement, where much activity was observed the previous month, and a drive towards the 25,980 level would reinforce a continuation of the trend. From levels around 25,425, the move toward 25,980 would be an approximate 2.7 times R/W ratio.
We could also watch for a confirmation. A strong daily close above 25,600, ideally accompanied by rising volume, could provide stronger evidence that the resistance has been broken, and remaining above these levels would support this thesis. In that case, the fib levels around 25,780, 25,980 and 26,260 become the next levels of resistance.
What Would Turn the Picture Bearish?
The bullish argument would weaken significantly if the DAX falls back below 25,250.
A break below 25,000 would put the October low around 24,940 back into focus. That level is particularly important because it represents the point from which the current recovery began.
If 24,940 breaks decisively, the current rebound would look increasingly like a failed recovery rather than the beginning of a new uptrend. The next downside areas would then be the July lows around 24,700.
Technical Verdict
The long-term trend remains bullish, daily momentum appears to be improving, and buyers have successfully defended the area around 25,000. At the same time, the index is now approaching one of the most important technical barriers on the chart.
The 25,480–25,600 zone is the key test.
A convincing break above it would shift the balance firmly toward the bulls and open the way toward 25,780, 25,980 and potentially 26,260. A rejection followed by a move below 25,250 would tell a very different story and suggest that the correction still has not been fully developed.
The market is currently at an important technical level, and the way it behaves around this zone should provide considerably more information than the direction of the last few trading sessions.
Regards,
Philip Papageorgiou
By Philip J Papageorgiou - Head of Investment Research
Find him on X (x twitter) - PhilipForexCom



The complete CFD trading experience
Award-winning platforms, competitive spreads, low commissions and dedicated support.
We live and breathe the markets and are dedicated to helping traders realise their ambitions as we continue to set the industry bar.
Economic calendar
Web Trader platform
Our sophisticated web-based platform is packed with features.
Related articles
DAX Recovery Tested at Key 25,500 Resistance Zone
The DAX has recovered sharply from its September correction, climbing back above 25,000 after successfully holding long-term support near the 200-day moving average. While the broader bull trend remains intact, the index is now approaching one of the most important technical resistance zones on the chart. A break above 25,500–25,600 would strengthen the bullish case and open the door toward 26,000 and eventually the August record high. Failure at this level would suggest the recent move remains a corrective rebound rather than the start of a new leg higher.

USD Majors Test Critical Levels Post-NFP | Weekly Technical Outlook 10 5 2026
Sr. Technical Strategist Michael Boutros highlights the levels that matter on the USD Majors, commodities, and equity indices charts this week.


EUR/USD Forecast: France’s Fiscal Risks are Mounting as Yields Near 5%
EUR/USD is falling as France’s borrowing costs have climbed to their highest levels in more than two decades, with 10-year OATs testing 5.00% - what are the next levels to watch?

StoneX Europe Ltd may make third party material available on this website which may contain information included but not limited to the conditions of financial markets. The material is for information purposes only and does not contain, and should not be construed as containing, investment advice and/or investment recommendation and/or an investment research and/or an offer of or solicitation for any transactions in financial instruments; any decision to enter into a specific transaction shall be made by the client following an assessment by him/her of their situation.
StoneX Europe Ltd makes no representation or warranty and assumes no liability as to the accuracy or completeness of the information provided, nor any loss arising from any investment based on a recommendation, forecast or other information supplied. You should always seek independent advice as to your suitability to speculate in any related markets and your ability to assume the associated risks, if you are at all unsure. We are not under any obligation to update any such material. Any opinion made may be personal to the author and may not reflect the opinion of StoneX Europe Ltd.