




Disappointing Canadian Data Continues into 2020
USD/CAD should remain volatile over the next 24 hours.
Share this:

Canada released Housing Starts (MoM) for December earlier today for December 2019 at 197,300 vs an expectation of 210,000. Building Permits (MoM) for November 2019 were released as well at -2.4% vs -1.5% expected. These data points by themselves do not provide much value, however taken with the recent weaker than expected manufacturing data, retail sales data, and trade data, the BOC may have to start considering lowering rates when they meet again on January 22nd. Tomorrow we see the Employment Change (MoM) for December for Canada. While November’s number was surprisingly weak last month at -71,000, December’s expectation is for a return to positive territory at 25,000. One bright side to Canadian data is that inflation has remained in check.
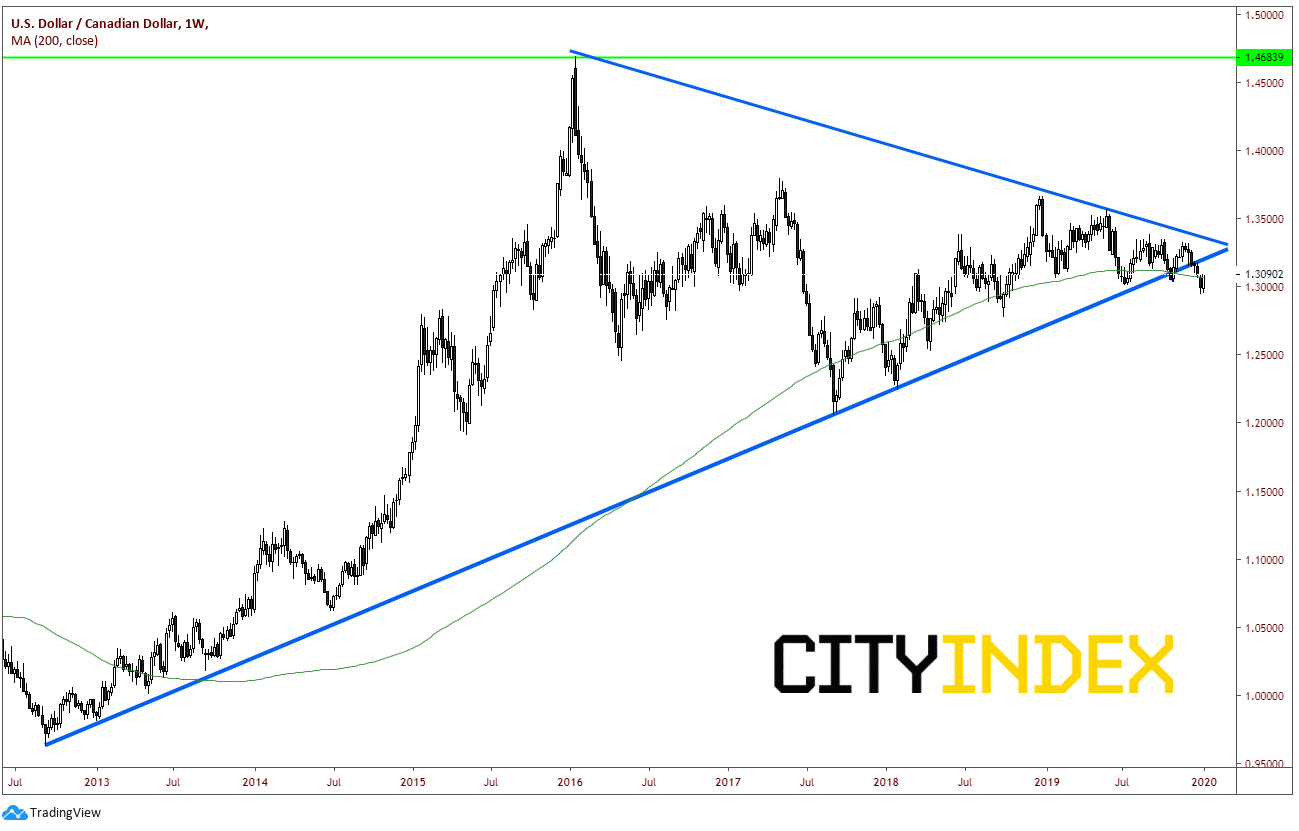
Towards the end of December 2019, USD/CAD finally broke down from its long-term, symmetrical triangle and its upward sloping multi year trendline that has been in place since 2012. In addition, last week the pair broke below the 200-week moving average near 1.3070.
Source: Tradingview, City Index
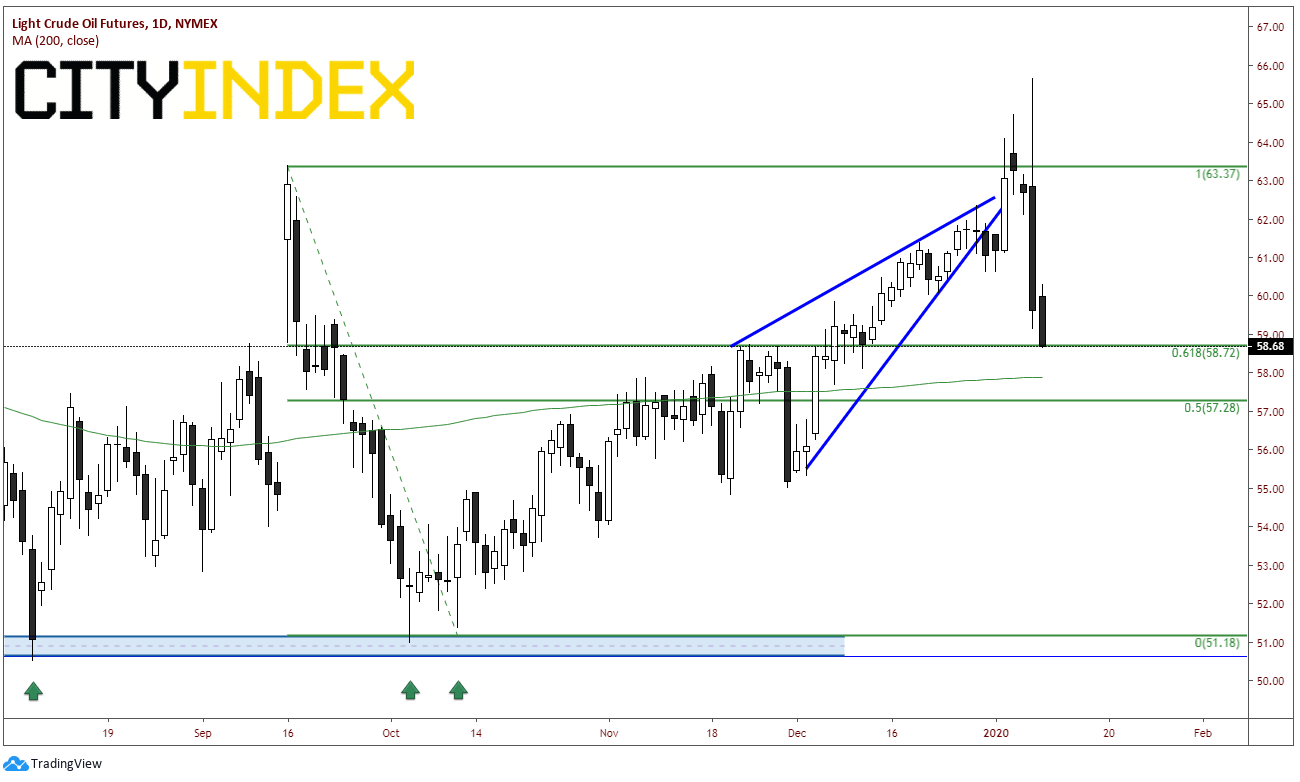
The rise in crude oil prices likely helped contribute to this move as the direction of crude oil and the price of the Canadian Dollar are positively correlated (crude oil and USD/CAD are inversely related). However, with yesterday’s large move lower in oil (and today’s continued selloff), prices in USD/CAD have reversed. Crude oil futures are currently holding support near 58.65.
Source: Tradingview, NYMEX, City Index
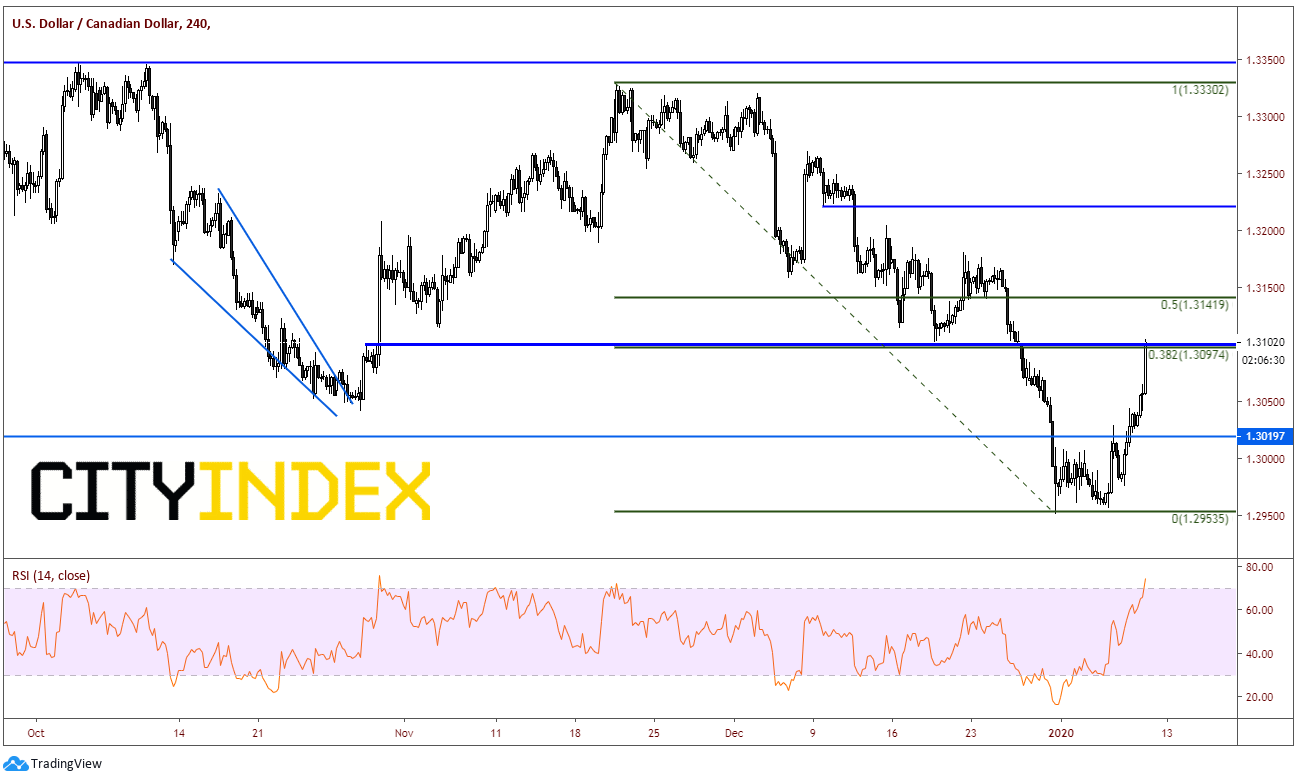
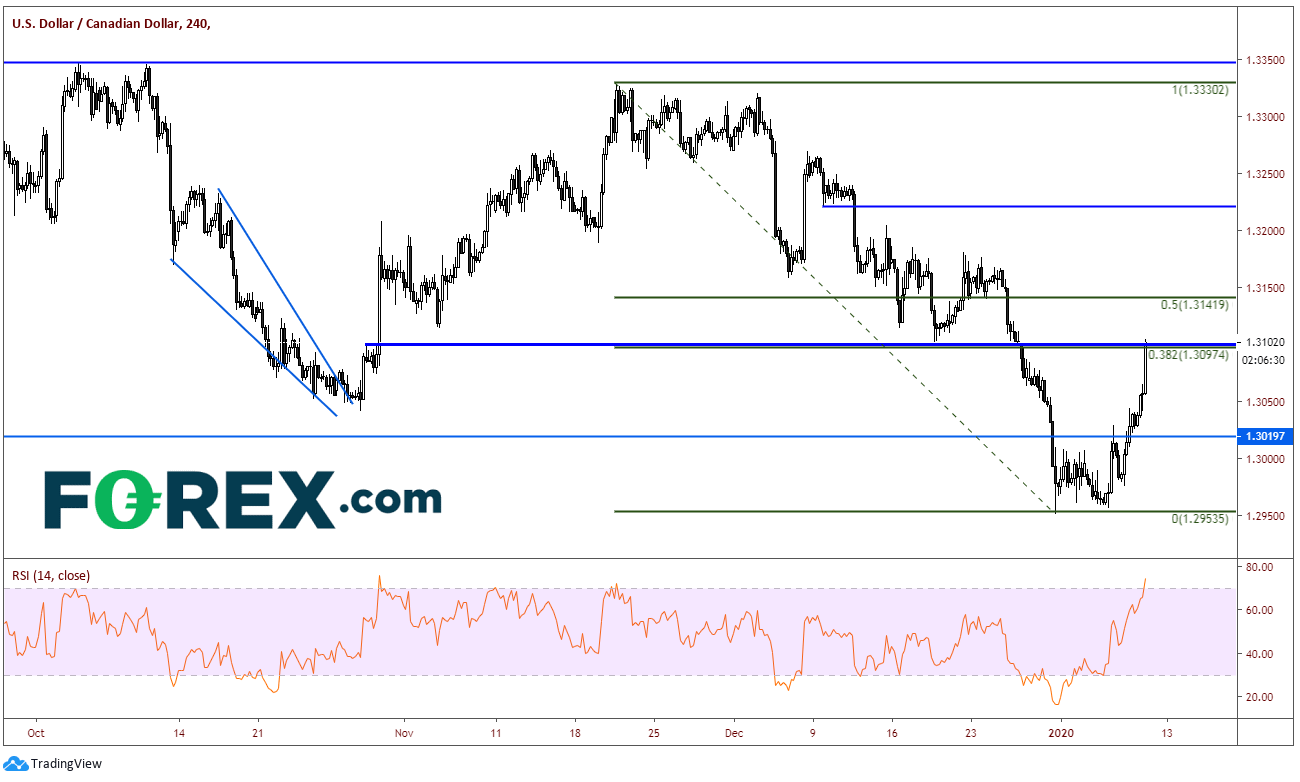
USD/CAD is currently running right into horizontal resistance near 1.3100. This level also coincides with the 38.2% Fibonacci retracement from the November 20th highs to the December 31st lows. The RSI has also moved into overbought territory, and indication that prices may turn lower soon. Short term resistance comes across at the 50% retracement level of the previously mentioned timeframe near 1.3140, and then a cluster of resistance near 1.3200, including the 61 8% Fibonacci retracement level, horizontal resistance, and a retest of the upward sloping trendline on the weekly timeframe. Support comes across at the 200-week moving average at 1.3070 and recent lows near 1.2950.
Source: Tradingview, City Index
Later today, Bank of Canada’s (BOC) Governor Poloz speaks. He may try and clarify the BOC’s position on interest rates. In addition, traders may try and position themselves ahead of both US and Canadian payroll data tomorrow morning. We also need to continue to watch crude oil for price direction. The combination of these factors should keep USD/CAD volatile over the next 24 hours.
Canada released Housing Starts (MoM) for December earlier today for December 2019 at 197,300 vs an expectation of 210,000. Building Permits (MoM) for November 2019 were released as well at -2.4% vs -1.5% expected. These data points by themselves do not provide much value, however taken with the recent weaker than expected manufacturing data, retail sales data, and trade data, the BOC may have to start considering lowering rates when they meet again on January 22nd. Tomorrow we see the Employment Change (MoM) for December for Canada. While November’s number was surprisingly weak last month at -71,000, December’s expectation is for a return to positive territory at 25,000. One bright side to Canadian data is that inflation has remained in check.
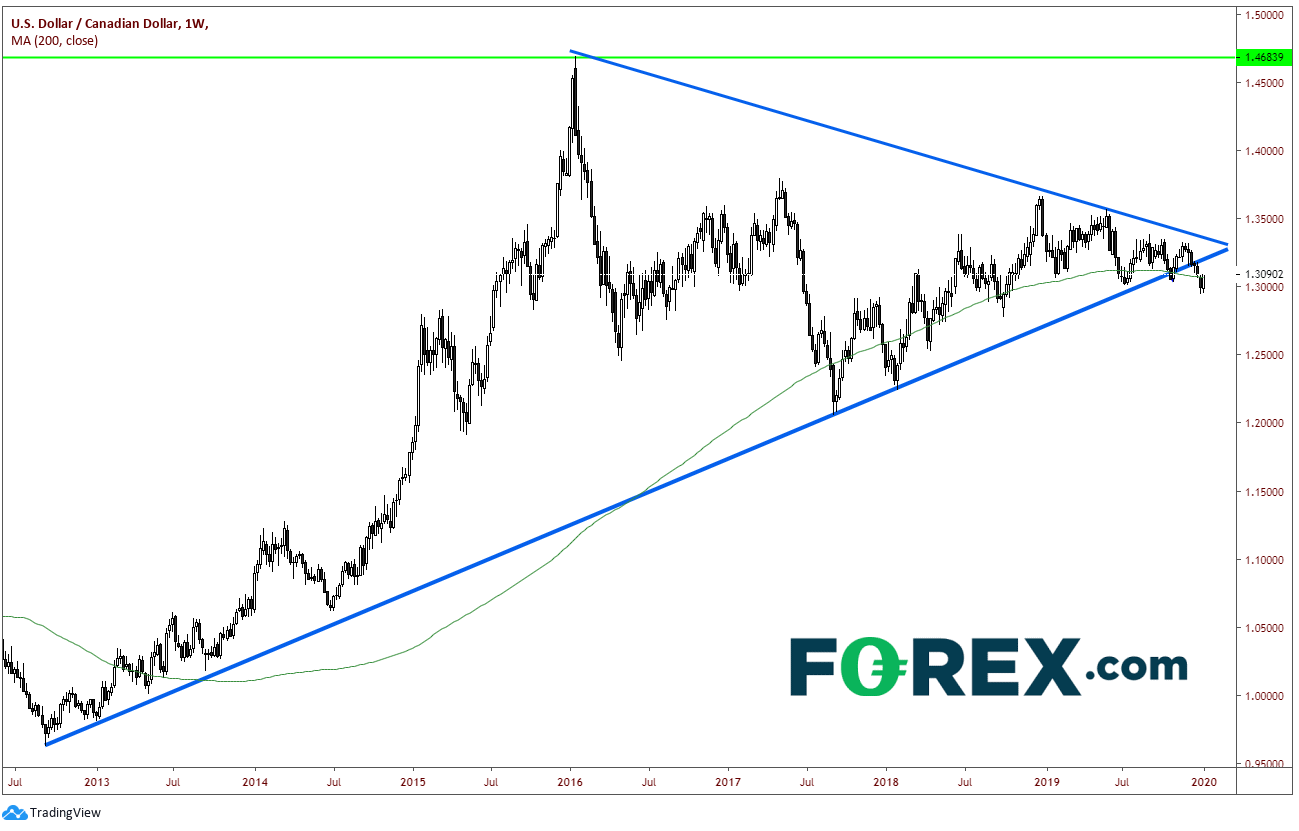
Towards the end of December 2019, USD/CAD finally broke down from its long-term, symmetrical triangle and its upward sloping multi year trendline that has been in place since 2012. In addition, last week the pair broke below the 200-week moving average near 1.3070.
Source: Tradingview, FOREX.com
The rise in crude oil prices likely helped contribute to this move as the direction of crude oil and the price of the Canadian Dollar are positively correlated (crude oil and USD/CAD are inversely related). However, with yesterday’s large move lower in oil (and today’s continued selloff), prices in USD/CAD have reversed. Crude oil futures are currently holding support near 58.65.
Source: Tradingview, NYMEX, FOREX.com
USD/CAD is currently running right into horizontal resistance near 1.3100. This level also coincides with the 38.2% Fibonacci retracement from the November 20th highs to the December 31st lows. The RSI has also moved into overbought territory, and indication that prices may turn lower soon. Short term resistance comes across at the 50% retracement level of the previously mentioned timeframe near 1.3140, and then a cluster of resistance near 1.3200, including the 61 8% Fibonacci retracement level, horizontal resistance, and a retest of the upward sloping trendline on the weekly timeframe. Support comes across at the 200-week moving average at 1.3070 and recent lows near 1.2950.
Source: Tradingview, FOREX.com
Later today, Bank of Canada’s (BOC) Governor Poloz speaks. He may try and clarify the BOC’s position on interest rates. In addition, traders may try and position themselves ahead of both US and Canadian payroll data tomorrow morning. We also need to continue to watch crude oil for price direction. The combination of these factors should keep USD/CAD volatile over the next 24 hours.
Latest market news




The complete CFD trading experience
Award-winning platforms, competitive spreads, low commissions and dedicated support.
We live and breathe the markets and are dedicated to helping traders realise their ambitions as we continue to set the industry bar.
Economic calendar
Web Trader platform
Our sophisticated web-based platform is packed with features.
Related articles
EUR/USD Q4 2026 Outlook: Euro at a Crossroads as Fed, ECB Tighten 9 25 2026
EUR/USD enters Q4 at a pivotal inflection point as competing Fed-ECB policy paths and persistent inflation risks collide with major technical support.

S&P 500 Forecast: SPX rises as oil prices fall, but treasuries remain at multi-decade highs
U.S. stocks are rising on Friday after a volatile week that saw a surge in Treasury yields ripple through financial markets.

USD/JPY Q4 2026 Outlook: Hawkish Fed Pricing Clashes With Intervention Risk
The year-end tug-of-war is clear: hawkish Fed pricing supports USD/JPY, while intervention risk limits the upside.

StoneX Europe Ltd may make third party material available on this website which may contain information included but not limited to the conditions of financial markets. The material is for information purposes only and does not contain, and should not be construed as containing, investment advice and/or investment recommendation and/or an investment research and/or an offer of or solicitation for any transactions in financial instruments; any decision to enter into a specific transaction shall be made by the client following an assessment by him/her of their situation.
StoneX Europe Ltd makes no representation or warranty and assumes no liability as to the accuracy or completeness of the information provided, nor any loss arising from any investment based on a recommendation, forecast or other information supplied. You should always seek independent advice as to your suitability to speculate in any related markets and your ability to assume the associated risks, if you are at all unsure. We are not under any obligation to update any such material. Any opinion made may be personal to the author and may not reflect the opinion of StoneX Europe Ltd.