





Dont Fight the Fed Yields Gold and DXY
Interpreting key levels in the markets are important for traders to understand
Share this:

The Federal Reserve has been telling us time and time again that they are going to keep monetary policy accommodative until ACTUAL inflation is within the 2%-3% range. They told us inflationary expectations are transitory and that the rising in yields was unsustainable. Yet even with strong US data today (Retail Sales, NY Empire State Manufacturing Index, Philadelphia Fed Manufacturing Index, and Initial Jobless Claims), yields fell, and gold soared. Either someone has decided that it is time to believe the Fed or that now is the perfect time for a short squeeze in bonds! Note that the DXY barely moved all day, which is an indication that it may be the latter. (Stocks are higher too, but stocks always move higher!)
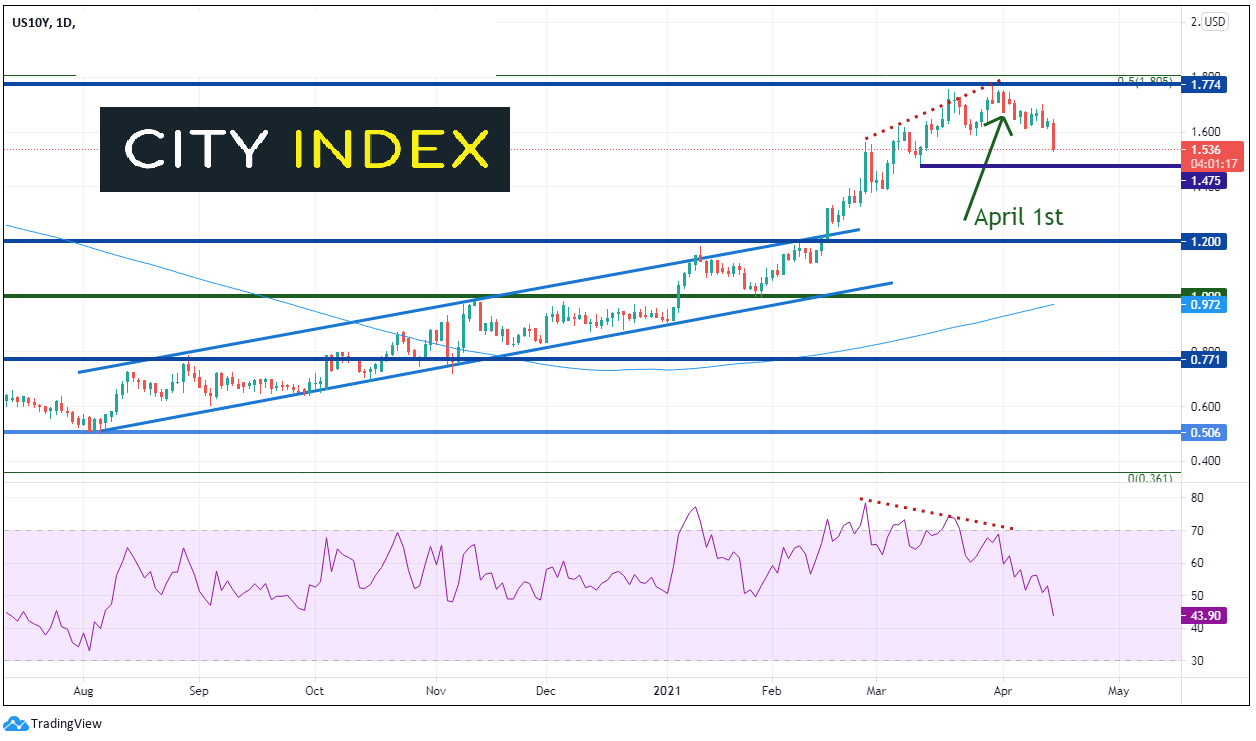
Since the beginning of April and the beginning of the second quarter, bonds have become a “buy” for the markets. Yields move inversely to bonds. Therefore, as bonds rose in price, yields fell. 10-year yields put in new recent highs on March 30th near the 50% retracement level from the November 2018 highs to the March 2020 lows, at 1.774 and have been moving lowed since. Note that at the highs, the RSI was diverging with price while in overbought territory.
Source: Tradingview, City Index
One can also argue that the move in yields was purely technical driven. On a 240-minute timeframe, as 10-year yields were moving higher into late March they formed the left shoulder of a head-and-shoulders pattern. Today, with the move lower, yields broke the below the neckline of the pattern. The target for a head-and-shoulders pattern is the height from the head to the neckline, added to the breakdown point of the right shoulder, which in this case is near 1.437. However, the RSI has moved into oversold territory, which indicates a near-term bounce is possible. Horizontal support is just above the target at the March 11th lows near 1.475 and then way below the target at 1.20 (see daily). Resistance is now back at the neckline at 1.618 (not the Fib level!) and then the top of the right shoulder at 1.701.
Source: Tradingview, City Index
Gold (XAU/USD) moves inversely to yields. Therefore, as yields move lower, gold moves higher. With the move lower in yields today, gold pushed higher above resistance at 1755 and formed a double bottom pattern. The target for a double bottom is the height of the pattern added to the breakout point, which is near 1830. Gold has been in a long-term channel downtrend since the summer of 2020. Resistance is at the top downward sloping trendline of the channel near 1810. Above the target, next resistance is at the 200 Day Moving Average near 1856.97. Horizontal support is at the April 13th lows near 1727 and then the double bottom lows at 1678.
Source: Tradingview, City Index
Learn how to start gold trading
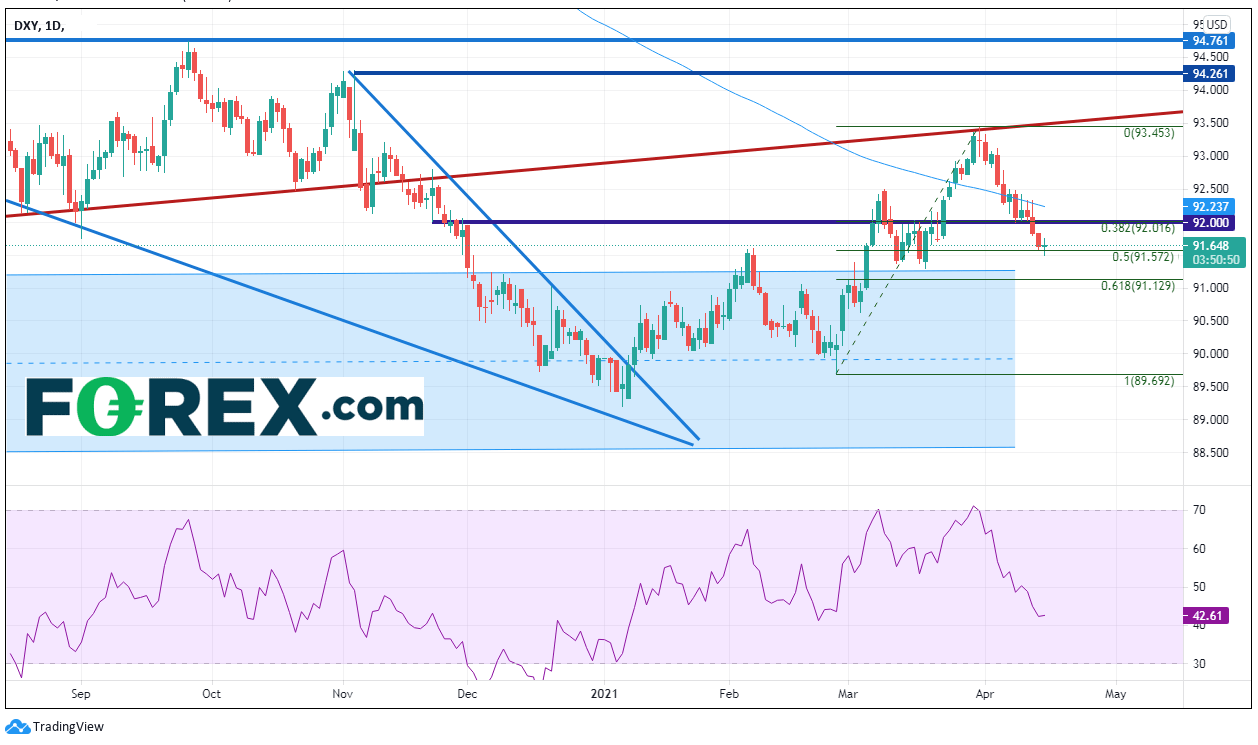
Last week, we discussed how DXY and gold are also inversely related and that a break of 92.00 in the DXY should push gold above the neckline of a double bottom at 1755. Was the DXY a leading indicator? On Tuesday, DXY broke below 92.00. However, it took until today for Gold to push above 1755. With Gold up 1.7% and 10-year yields down over 6%, the DXY was nearly unchanged, holding the 50% retracement level from the February 25th lows to the March 31st highs near 91.57.
Source: Tradingview, City Index
Everything you need to know about DXY
Today’s move in yields could have been position related (don’t fight the Fed), a short-squeeze, technical, or “catch up” to the DXY. The reason doesn’t matter. However, markets rarely move in a straight line. Interpreting key levels in the markets, such as head-and shoulders necklines, double bottom breakout levels and important retracement levels, are important for traders to know. Traders must also understand how a break in one market could affect price action of other correlated markets!
Learn more about forex trading opportunities.
The Federal Reserve has been telling us time and time again that they are going to keep monetary policy accommodative until ACTUAL inflation is within the 2%-3% range. They told us inflationary expectations are transitory and that the rising in yields was unsustainable. Yet even with strong US data today (Retail Sales, NY Empire State Manufacturing Index, Philadelphia Fed Manufacturing Index, and Initial Jobless Claims), yields fell, and gold soared. Either someone has decided that it is time to believe the Fed or that now is the perfect time for a short squeeze in bonds! Note that the DXY barely moved all day, which is an indication that it may be the latter. (Stocks are higher too, but stocks always move higher!)
Since the beginning of April and the beginning of the second quarter, bonds have become a “buy” for the markets. Yields move inversely to bonds. Therefore, as bonds rose in price, yields fell. 10-year yields put in new recent highs on March 30th near the 50% retracement level from the November 2018 highs to the March 2020 lows, at 1.774 and have been moving lowed since. Note that at the highs, the RSI was diverging with price while in overbought territory.
Source: Tradingview, FOREX.com
One can also argue that the move in yields was purely technical driven. On a 240-minute timeframe, as 10-year yields were moving higher into late March they formed the left shoulder of a head-and-shoulders pattern. Today, with the move lower, yields broke the below the neckline of the pattern. The target for a head-and-shoulders pattern is the height from the head to the neckline, added to the breakdown point of the right shoulder, which in this case is near 1.437. However, the RSI has moved into oversold territory, which indicates a near-term bounce is possible. Horizontal support is just above the target at the March 11th lows near 1.475 and then way below the target at 1.20 (see daily). Resistance is now back at the neckline at 1.618 (not the Fib level!) and then the top of the right shoulder at 1.701.
Source: Tradingview, FOREX.com
Gold (XAU/USD) moves inversely to yields. Therefore, as yields move lower, gold moves higher. With the move lower in yields today, gold pushed higher above resistance at 1755 and formed a double bottom pattern. The target for a double bottom is the height of the pattern added to the breakout point, which is near 1830. Gold has been in a long-term channel downtrend since the summer of 2020. Resistance is at the top downward sloping trendline of the channel near 1810. Above the target, next resistance is at the 200 Day Moving Average near 1856.97. Horizontal support is at the April 13th lows near 1727 and then the double bottom lows at 1678.
Source: Tradingview, FOREX.com
Learn how to start gold trading
Last week, we discussed how DXY and gold are also inversely related and that a break of 92.00 in the DXY should push gold above the neckline of a double bottom at 1755. Was the DXY a leading indicator? On Tuesday, DXY broke below 92.00. However, it took until today for Gold to push above 1755. With Gold up 1.7% and 10-year yields down over 6%, the DXY was nearly unchanged, holding the 50% retracement level from the February 25th lows to the March 31st highs near 91.57.
Source: Tradingview, FOREX.com
Everything you need to know about DXY
Today’s move in yields could have been position related (don’t fight the Fed), a short-squeeze, technical, or “catch up” to the DXY. The reason doesn’t matter. However, markets rarely move in a straight line. Interpreting key levels in the markets, such as head-and shoulders necklines, double bottom breakout levels and important retracement levels, are important for traders to know. Traders must also understand how a break in one market could affect price action of other correlated markets!
Related tags:
Latest market news




The complete CFD trading experience
Award-winning platforms, competitive spreads, low commissions and dedicated support.
We live and breathe the markets and are dedicated to helping traders realise their ambitions as we continue to set the industry bar.
Economic calendar
Web Trader platform
Our sophisticated web-based platform is packed with features.
Related articles
Gold Price Outlook: XAU/USD Resistance at $4200 Sets Up for NFP
It was a strong sell-off to start the week in gold and despite a Tuesday bounce, sellers are continuing to push following a resistance hit at the $4200 level.
EUR/USD Forecast: Euro Struggles to Find Support Even After U.S. PCE Data
The euro continues to face a challenging environment in the short term. The currency has struggled to regain ground against a U.S. dollar that remains firmly supported, a dynamic reflected in EUR/USD, which has now recorded three consecutive losing sessions and a decline of roughly 0.6%.

Canadian Dollar Forecast: USD/CAD Four-Week Rally Eyes Yearly Highs 9 30 2026
USD/CAD has advanced in 14 of the past 15 sessions, but stretched momentum raises the stakes as major resistance and NFP come into focus.

StoneX Europe Ltd may make third party material available on this website which may contain information included but not limited to the conditions of financial markets. The material is for information purposes only and does not contain, and should not be construed as containing, investment advice and/or investment recommendation and/or an investment research and/or an offer of or solicitation for any transactions in financial instruments; any decision to enter into a specific transaction shall be made by the client following an assessment by him/her of their situation.
StoneX Europe Ltd makes no representation or warranty and assumes no liability as to the accuracy or completeness of the information provided, nor any loss arising from any investment based on a recommendation, forecast or other information supplied. You should always seek independent advice as to your suitability to speculate in any related markets and your ability to assume the associated risks, if you are at all unsure. We are not under any obligation to update any such material. Any opinion made may be personal to the author and may not reflect the opinion of StoneX Europe Ltd.