


Dow Jones Outlook: DJIA closes the week below 48,000 amid persistent tensions and weak NFP data
It has been a difficult week for the Dow Jones index, as a consistent decline has taken place throughout the week, with losses now exceeding 2.6% over the last two trading sessions. For now, selling pressure has been sustained by ongoing uncertainty stemming from geopolitical tensions in the Middle East, as well as potential economic slowdown reflected in the recent US employment data.
Share this:

It has been a difficult week for the Dow Jones index, as a consistent decline has taken place throughout the week, with losses now exceeding 2.6% over the last two trading sessions. For now, selling pressure has been sustained by ongoing uncertainty stemming from geopolitical tensions in the Middle East, as well as potential economic slowdown reflected in the recent US employment data. Both factors have prevented confidence from consolidating, and as long as economic and geopolitical uncertainty persists, meaningful selling pressure could continue to influence the index in the short term.


Risk increases
The defining factor of the week has been the escalation of military tensions in the Middle East. The United States and Iran have yet to reach an agreement that could lead to short-term de-escalation, and recent comments from Trump suggest that the only resolution would be Iran’s surrender. This has increased concerns about prolonged tensions and has helped keep uncertainty elevated across financial markets.
Despite calls for calm and dialogue from organizations such as the United Nations, these efforts have not been sufficient to reduce friction between the parties involved. Markets now fear that the escalation could become more aggressive in the coming sessions if no meaningful agreements are reached in the short term.
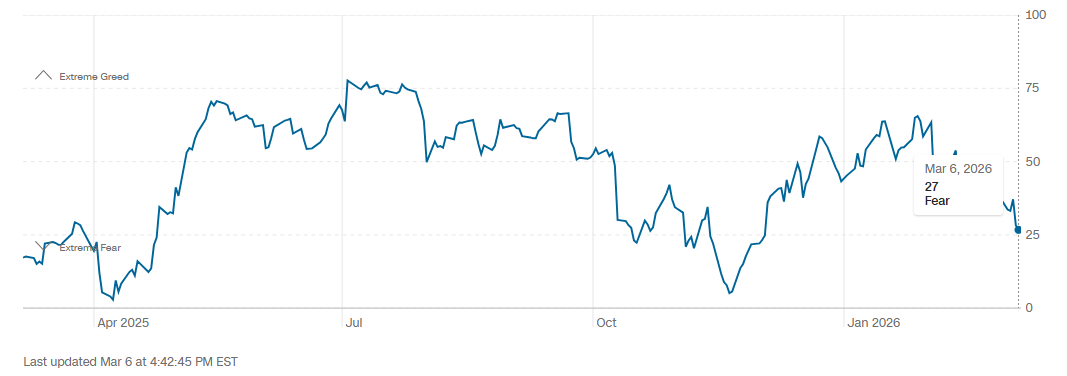
The sensitivity of risk markets is already being reflected in confidence indicators. The CNN Fear and Greed Index remain around 27 points, moving progressively closer to “extreme fear” territory. This reflects a continued deterioration in market confidence during recent sessions.
Source: CNN
In this context, while market confidence remains in cautious territory, it will be difficult to consolidate solid demand in equity markets, particularly in the Dow Jones index. Additionally, the escalation of the conflict has increased global inflation expectations, driven by higher prices in energy commodities such as oil. This environment tends to favor safe-haven assets such as US Treasuries, reducing the appeal of equity indices in the short term. If geopolitical tensions persist, market fear could continue to rise and generate meaningful selling pressure on the Dow Jones in the coming sessions.
Employment data do not help
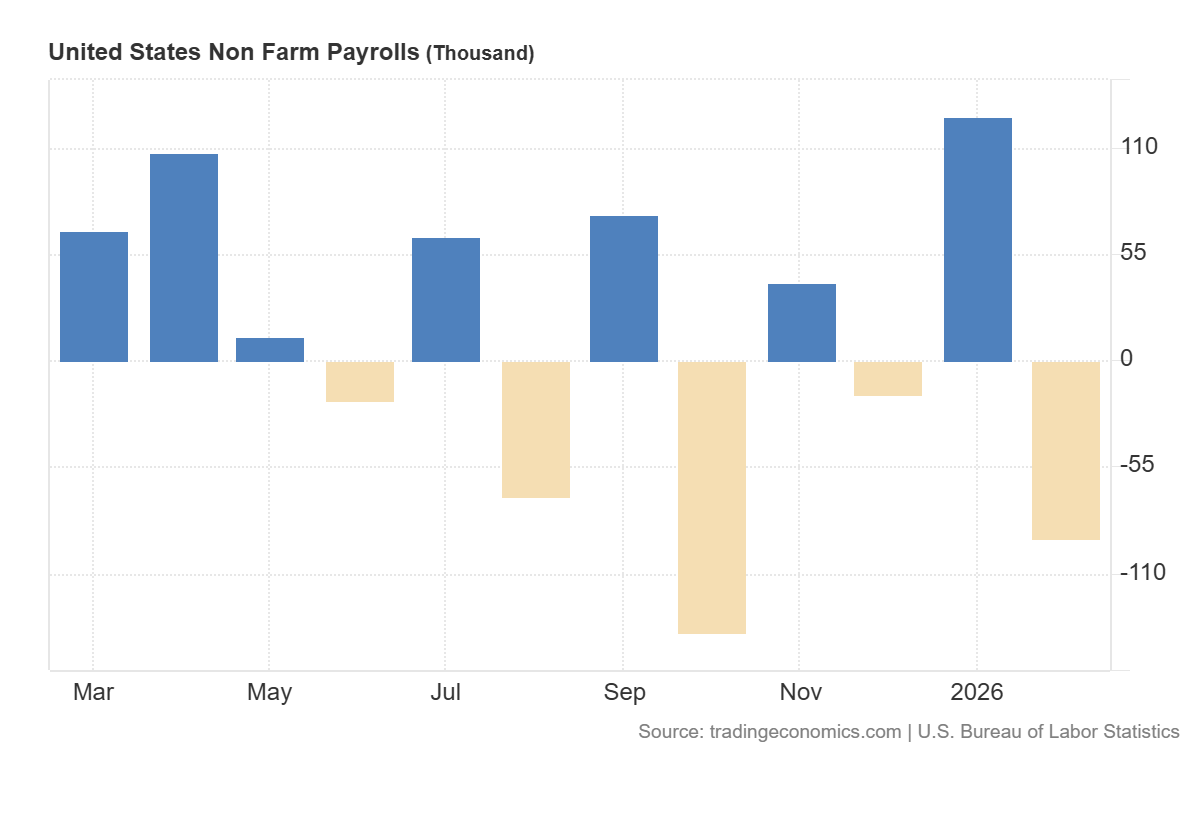
During the session, US employment data was released, and markets were surprised by a 92,000 job loss in February, well below the forecast of +58,000 new jobs and also below the previous reading of +126,000 jobs. This outcome has begun to highlight that labor market dynamics in the United States are not entirely solid, reinforcing signs of consistent weakness.
Source: TradingEconomics
The data are relevant because they may signal that the economy is losing momentum, which could eventually lead to slower consumption in the coming months and pressure corporate earnings. This scenario does not present favorable conditions for equity market demand or for the Dow Jones as one of the primary benchmark indices.
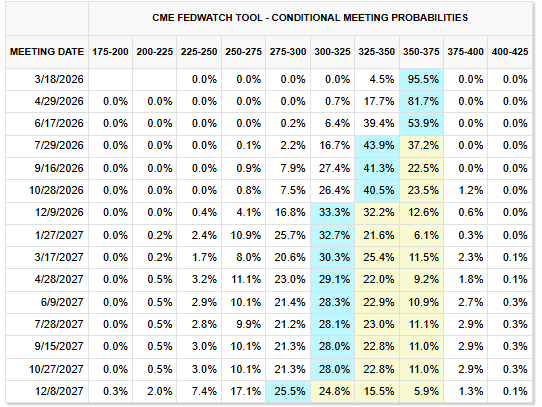
Moreover, despite the weak employment data, monetary policy expectations have not changed significantly. Markets still assign a probability above 80% that interest rates will remain at 3.75% in the March and April decisions, while the probability of unchanged rates for June remains above 50%. This occurs even as labor data begins to show meaningful signs of deceleration.
Source: CMEGROUP
It is important to remember that equity indices typically benefit from environments of lower interest rates, as borrowing costs decline and consumption is stimulated. However, given expectations that such a scenario will not materialize in the short term, a high-rate environment may not support confidence or demand for equities.
Thus, the combination of weak employment data and expectations that interest rates will remain elevated complicates the outlook for a strong equity market in the short term, which could continue generating consistent selling pressure on the Dow Jones in the coming sessions.
Technical outlook for the Dow Jones
Source: StoneX, Tradingview
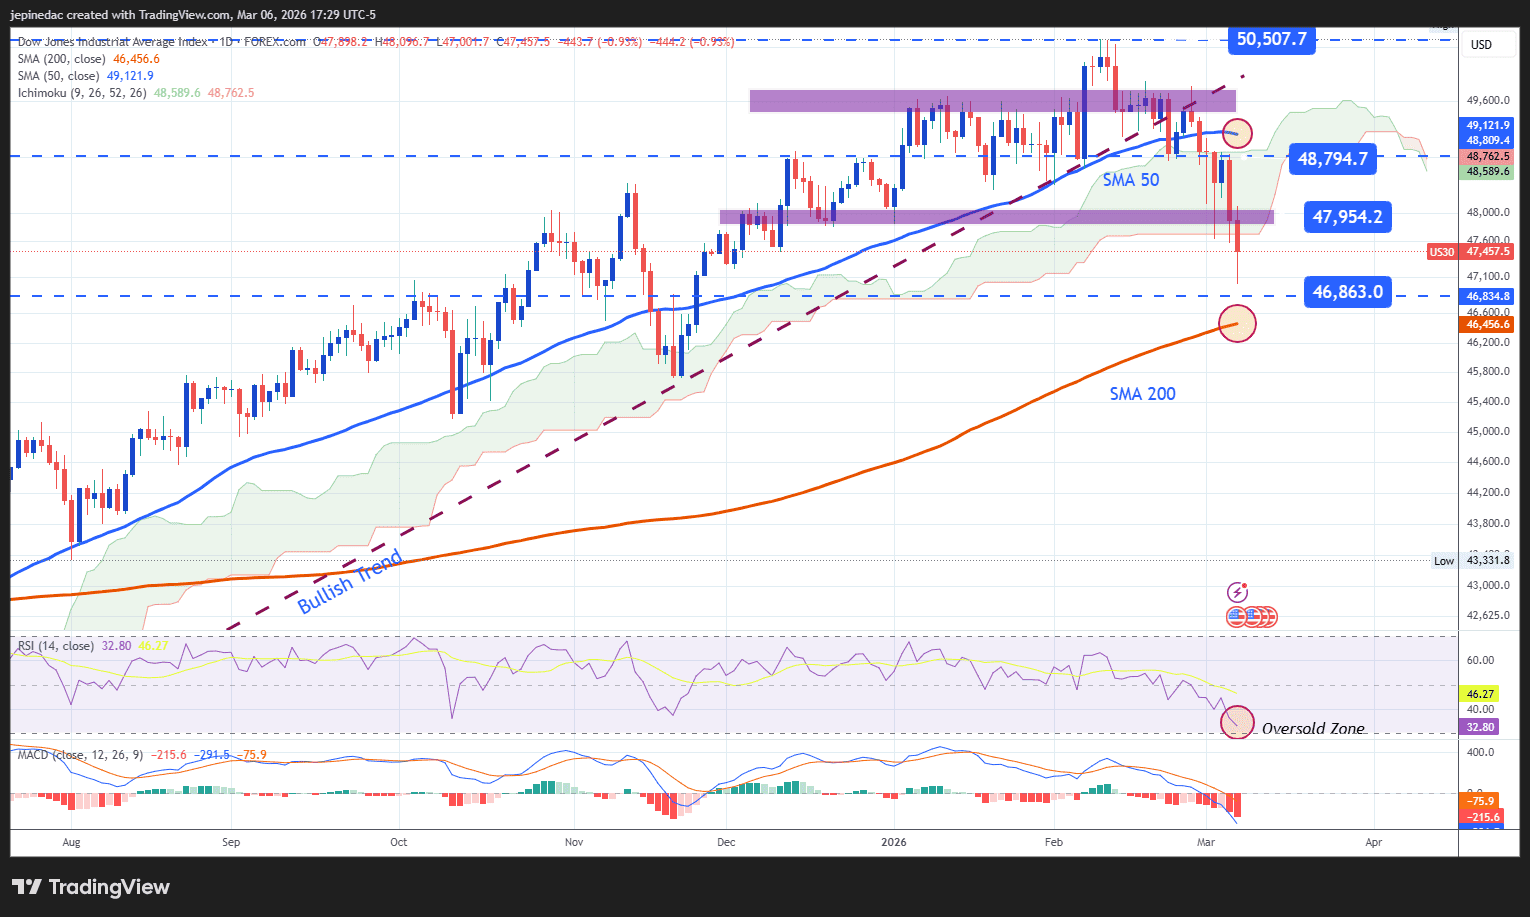
- Bearish movement begins to consolidate: After the break of the long-standing upward trendline, selling pressure in the Dow Jones has become increasingly evident, with key support levels breached in recent sessions. If this behavior continues in the medium term, a more relevant downward trendline could begin to form on the chart. However, it is important to note that if bearish momentum begins to show signs of exhaustion, corrective rebounds could emerge in the short term.
- RSI: The RSI remains below the neutral 50 level, indicating selling dominance in the average momentum of the past 14 sessions. However, the indicator is approaching the 30 level, which could begin to signal oversold conditions and highlight excessive bearish pressure, opening the door for short-term bullish corrections.
- MACD: The MACD histogram continues to oscillate below the zero line, reflecting that short-term moving average momentum remains tilted to the downside. This suggests that bearish pressure could remain relevant as long as this dynamic persists.
Key levels:
- 48,794 points – Relevant resistance: A neutrality level near the 50-period moving average. Moves back toward this zone could trigger a more consistent indecision phase and lead to the formation of a short-term sideways range.
- 47,954 points – Near-term barrier: A neutrality zone that has generated stability in recent weeks and may serve as a reference level for potential short-term corrective rebounds.
- 46,863 points – Key support: A level corresponding to prices not seen since November 2025 and near the 200-period simple moving average. Sustained moves below this zone could confirm a structural shift in the chart and open the door to a more consistent bearish trend in the coming sessions.
Written by Julian Pineda, CFA, CMT – Market Analyst
Follow him on: @julianpineda25
Latest market news




The complete CFD trading experience
Award-winning platforms, competitive spreads, low commissions and dedicated support.
We live and breathe the markets and are dedicated to helping traders realise their ambitions as we continue to set the industry bar.
Economic calendar
Web Trader platform
Our sophisticated web-based platform is packed with features.
Related articles

Dow Jones outlook: CPI, oil and yields put the rally to the test
US index futures rebounded in the first half of Wednesday’s session, along with European indices ahead of the release of US CPI. Some slightly dovish remarks from the Fed’s Williams seem to have helped sentiment a little, but whether those comments will be backed by data remains to be seen. While slightly hotter than expected inflation data shouldn’t be enough for markets to price in an October Fed hike with more than a coin flip probability, it can nonetheless reinforce expectations of further tightening later in the year.


Russell 2000 breaks 200-day average as CPI risk looms
US small caps have lost nearly 9% since August, with surging Treasury yields overwhelming a historically favourable midterm trading period. Now the Russell 2000 is threatening to break a major support zone ahead of US CPI.


DAX Recovery Faces Key Test as Bulls Challenge 25,500 Resistance
The DAX continues to recover from last week's sell-off, supported by easing energy concerns and improving short-term momentum. While buyers have regained control of the four-hour trend, the index is now approaching a critical resistance zone between 25,450 and 25,600. A decisive break higher would strengthen the bullish case and open the door toward 25,800, while failure at resistance could quickly revive downside pressure.

StoneX Europe Ltd may make third party material available on this website which may contain information included but not limited to the conditions of financial markets. The material is for information purposes only and does not contain, and should not be construed as containing, investment advice and/or investment recommendation and/or an investment research and/or an offer of or solicitation for any transactions in financial instruments; any decision to enter into a specific transaction shall be made by the client following an assessment by him/her of their situation.
StoneX Europe Ltd makes no representation or warranty and assumes no liability as to the accuracy or completeness of the information provided, nor any loss arising from any investment based on a recommendation, forecast or other information supplied. You should always seek independent advice as to your suitability to speculate in any related markets and your ability to assume the associated risks, if you are at all unsure. We are not under any obligation to update any such material. Any opinion made may be personal to the author and may not reflect the opinion of StoneX Europe Ltd.