



Eastern European EMs highly correlated to Ruble
Where can traders turn if they are interested in taking advantage of the move in USD/RUB? They can look west to USD/PLN, USD/HUF and USD/CZK.
Share this:

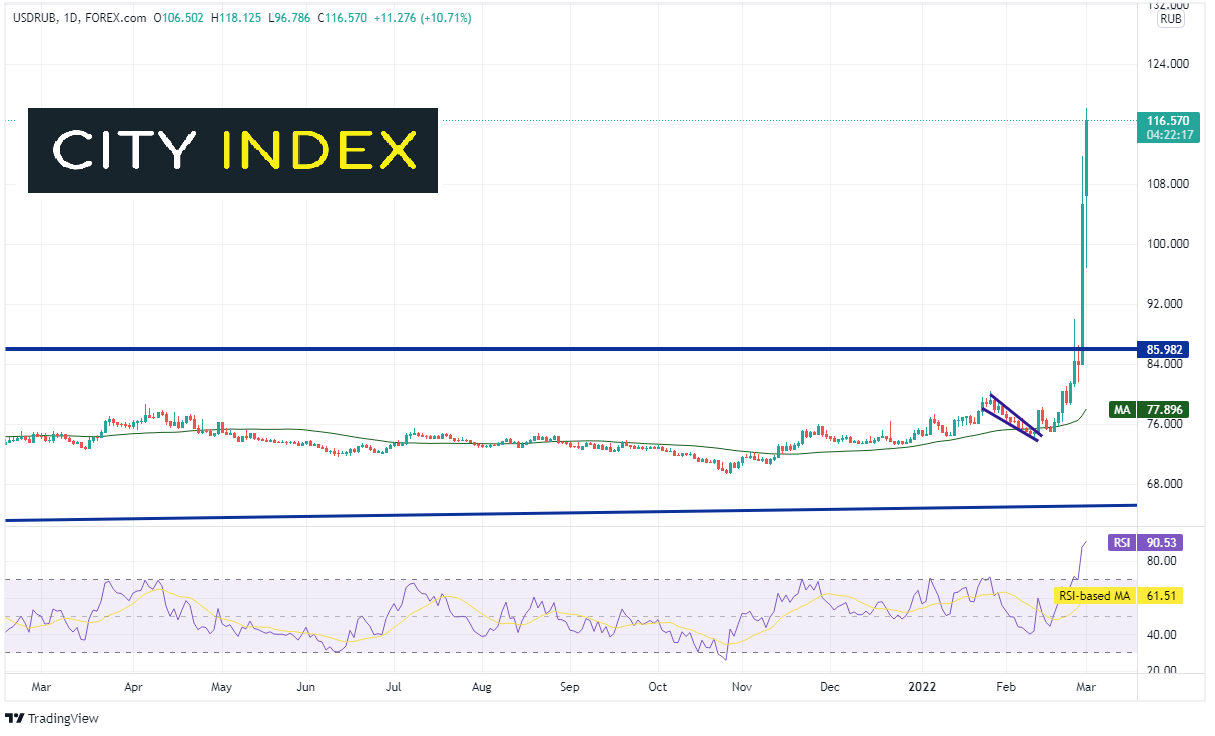
Once Russia invaded Ukraine, there was no looking back for USD/RUB. The Bank of Russia tried to stop the bleeding of the Ruble for a few days as the pair took out all-time highs at 85.98. However, this past weekend, Russia was taken off the SWIFT financial messaging system. Therefore, Russia was unable to make financial transactions with many countries. The Ruble melted and USD/RUB screamed higher to a high thus far today at 118.125. The Central Bank of Russia conceded and said it cannot prevent the collapse of the Ruble.

Source: Tradingview, Stone X
So where can traders turn if they are interested in taking advantage of the move in USD/RUB? They can look west to USD/PLN, USD/HUF and USD/CZK.
USD/PLN has been moving higher since the beginning of the invasion as well. Notice the correlation at the bottom of the screen is +0.93. A reading of +1.00 is considered a perfect positive correlation, in which the 2 assets move in the same direction 100% of the time. A reading above +0.80 is considered a strong correlation.
However, unlike USD/RUB, USD/PLN was held short of making all-time new highs today at 4.3078. The pair hasn’t traded this high since March 2020. There is also year long trendline that crosses just above today’s highs and the 127.2% Fibonacci extension from the highs of November 23rd, 2021 to the lows of February 10th at 4.2834. If USD/PLN can break into all-time high territory, the next level of resistance is the 161.8% Fibonacci extension from the same timeframe at 4.3841. However, notice that the RSI is in overbought territory (above 70). Therefore, price may be due for a pullback. First support is at the previous high of 4.2042, then Monday’s low at 4.1046, which is also the 50% retracement level from the February 10th lows to today’s highs.

Source: Tradingview, Stone X
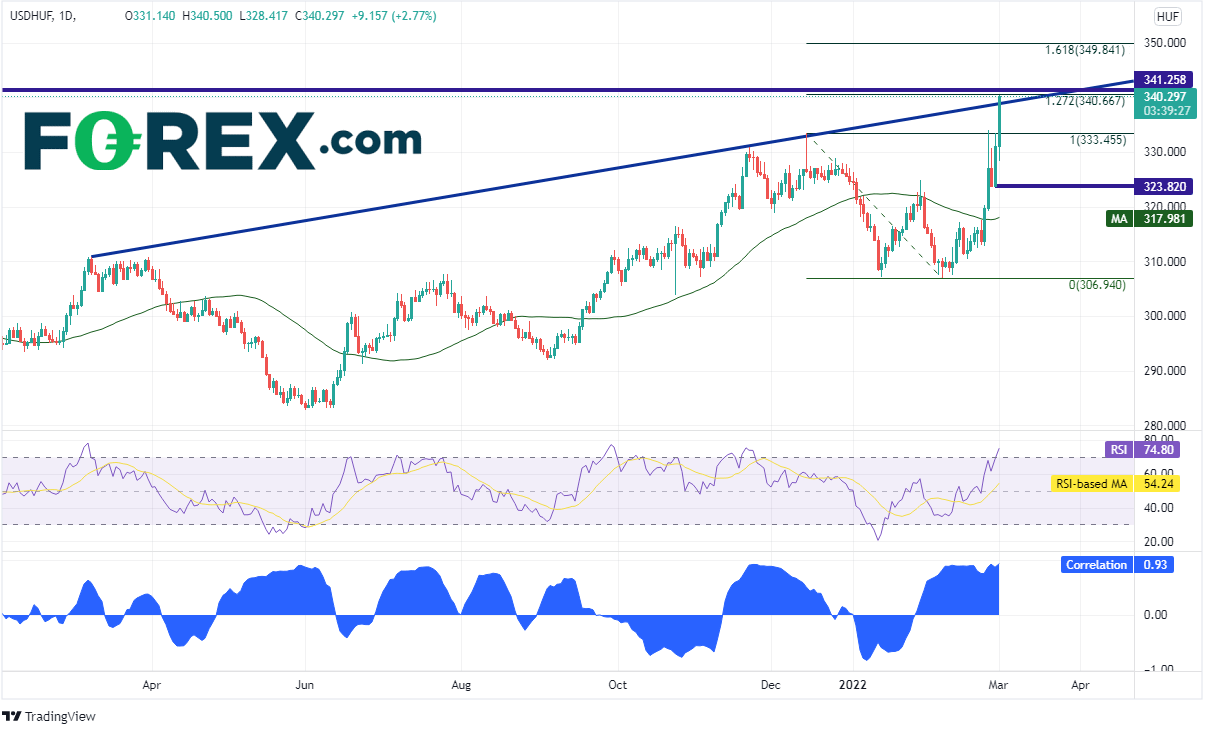
USD/HUF looks very similar to the chart of USD/PLN. The pair has been moving higher since the invasion began and was halted today at all-time highs near 340.67. The correlation coefficient between USD/HUF and USD/RUB is also +0.93. However, USD/HUF broke through the upward sloping trendline dating back to March 2021. If price breaks into new all-time high territory, resistance is at the 161.8% Fibonacci extension from the highs of December 15th, 2021 to the low of February 7th near 349.84. However, notice that the RSI is also overbought. Support is at the prior high of 333.46, then Monday’s low at 323.82, which is also the 50% retracement level from the February 7th lows to today’s highs.
Source: Tradingview, Stone X
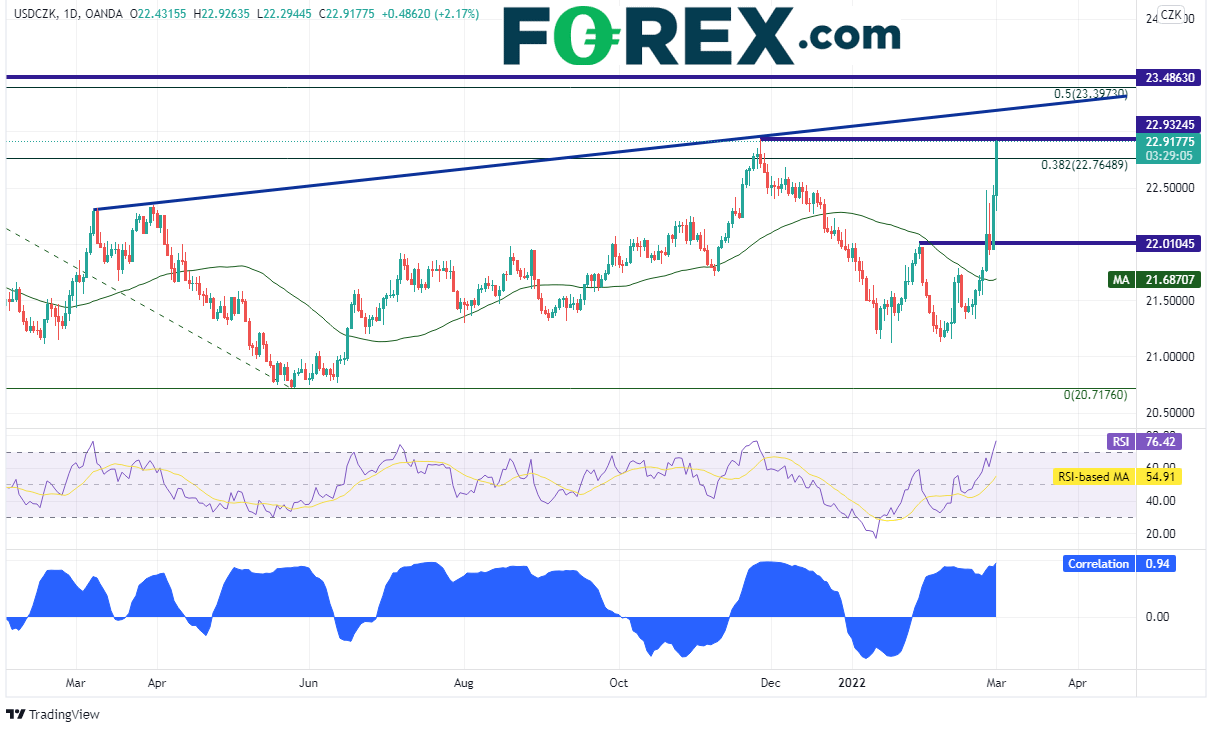
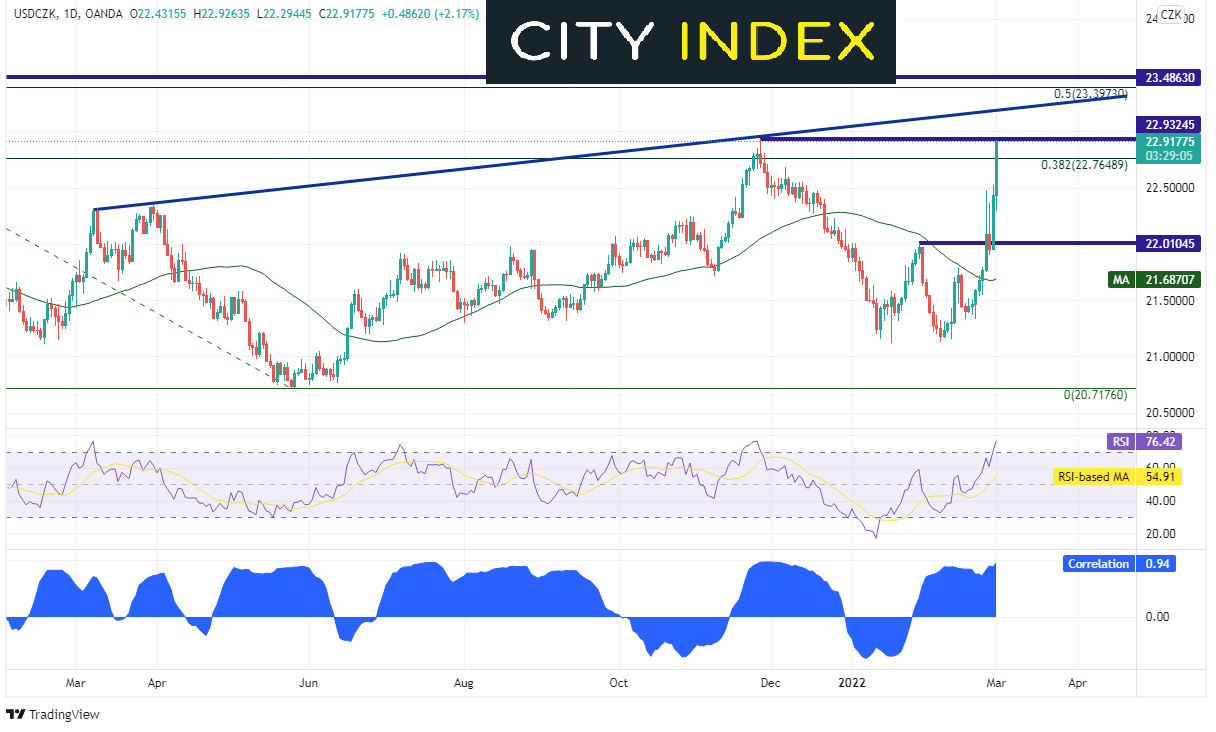
The chart of USD/CZK is somewhat like that of USD/PLN and USD/HUF, however there are many differences. The main takeaway is the correlation between USD/CZK and USD/RUB is +0.94. The pair has been moving higher today, however was halted at the highs of November 26th, 2021 near 22.9325. Resistance above is at the upward sloping trendline from March 2021 near 23.2000 and the 50% retracement from the all-time highs of March 2020 to the lows of May 25th, 2021 near 23.3973. Notice the RSI is overbought, indicating the pair may be ready for a pullback. First support is at Monday’s lows of 21.9563, which is also the 38.2% Fibonacci retracement from the February 7th lows to today’s highs, then the 50 Day Moving Average 21.6870.
Source: Tradingview, Stone X
The Ruble has been moving lower since the beginning of the invasion into Ukraine and has collapsed since Russia was removed from SWIFT. However, traders who are looking to take advantage of the move higher in USD/RUB can look to USD/PLN, USD/HUF or USD/CZK. These Eastern European EMs all have a strong correlation with USD/RUB!
Once Russia invaded Ukraine, there was no looking back for USD/RUB. The Bank of Russia tried to stop the bleeding of the Ruble for a few days as the pair took out all-time highs at 85.98. However, this past weekend, Russia was taken off the SWIFT financial messaging system. Therefore, Russia was unable to make financial transactions with many countries. The Ruble melted and USD/RUB screamed higher to a high thus far today at 118.125. The Central Bank of Russia conceded and said it cannot prevent the collapse of the Ruble.
Source: Tradingview, Stone X
So where can traders turn if they are interested in taking advantage of the move in USD/RUB? They can look west to USD/PLN, USD/HUF and USD/CZK.
What are Emerging Market currencies?
USD/PLN has been moving higher since the beginning of the invasion as well. Notice the correlation at the bottom of the screen is +0.93. A reading of +1.00 is considered a perfect positive correlation, in which the 2 assets move in the same direction 100% of the time. A reading above +0.80 is considered a strong correlation.
However, unlike USD/RUB, USD/PLN was held short of making all-time new highs today at 4.3078. The pair hasn’t traded this high since March 2020. There is also year long trendline that crosses just above today’s highs and the 127.2% Fibonacci extension from the highs of November 23rd, 2021 to the lows of February 10th at 4.2834. If USD/PLN can break into all-time high territory, the next level of resistance is the 161.8% Fibonacci extension from the same timeframe at 4.3841. However, notice that the RSI is in overbought territory (above 70). Therefore, price may be due for a pullback. First support is at the previous high of 4.2042, then Monday’s low at 4.1046, which is also the 50% retracement level from the February 10th lows to today’s highs.

Source: Tradingview, Stone X
USD/HUF looks very similar to the chart of USD/PLN. The pair has been moving higher since the invasion began and was halted today at all-time highs near 340.67. The correlation coefficient between USD/HUF and USD/RUB is also +0.93. However, USD/HUF broke through the upward sloping trendline dating back to March 2021. If price breaks into new all-time high territory, resistance is at the 161.8% Fibonacci extension from the highs of December 15th, 2021 to the low of February 7th near 349.84. However, notice that the RSI is also overbought. Support is at the prior high of 333.46, then Monday’s low at 323.82, which is also the 50% retracement level from the February 7th lows to today’s highs.

Source: Tradingview, Stone X
The chart of USD/CZK is somewhat like that of USD/PLN and USD/HUF, however there are many differences. The main takeaway is the correlation between USD/CZK and USD/RUB is +0.94. The pair has been moving higher today, however was halted at the highs of November 26th, 2021 near 22.9325. Resistance above is at the upward sloping trendline from March 2021 near 23.2000 and the 50% retracement from the all-time highs of March 2020 to the lows of May 25th, 2021 near 23.3973. Notice the RSI is overbought, indicating the pair may be ready for a pullback. First support is at Monday’s lows of 21.9563, which is also the 38.2% Fibonacci retracement from the February 7th lows to today’s highs, then the 50 Day Moving Average 21.6870.
Source: Tradingview, Stone X
The Ruble has been moving lower since the beginning of the invasion into Ukraine and has collapsed since Russia was removed from SWIFT. However, traders who are looking to take advantage of the move higher in USD/RUB can look to USD/PLN, USD/HUF or USD/CZK. These Eastern European EMs all have a strong correlation with USD/RUB!
Learn more about forex trading opportunities.
Related tags:
Latest market news




The complete CFD trading experience
Award-winning platforms, competitive spreads, low commissions and dedicated support.
We live and breathe the markets and are dedicated to helping traders realise their ambitions as we continue to set the industry bar.
Economic calendar
Web Trader platform
Our sophisticated web-based platform is packed with features.
Related articles
US Dollar, GBP/USD, USD/CAD, USD/CHF, Gold Weekly Technical Outlook 11 2 2026
Sr. Technical Strategist Michael Boutros highlights the levels that matter on the USD Majors, commodities, and equity indices charts this week.

US Midterm Forecast: The Key Risks for Traders to Watch Through the US Elections
Prediction markets are pricing in nearly 75% odds of a Democratic sweep in this week’s US midterm elections, a development that would result in a split from the single party Republican rule of the past two years - what will it mean for markets?

Gold forecast: XAU/USD stabilised after recent falls – for now
Gold has started the first week of the new month trying to recover some ground after another bruising week. Oil prices have taken a sharp drop and that has allowed risk assets to bounce back, which has clearly helped the precious metal too. However, with sentiment remaining bearish towards the metals, and with $4000 level having been taken out last week, the path of least resistance is to the downside for gold.

StoneX Europe Ltd may make third party material available on this website which may contain information included but not limited to the conditions of financial markets. The material is for information purposes only and does not contain, and should not be construed as containing, investment advice and/or investment recommendation and/or an investment research and/or an offer of or solicitation for any transactions in financial instruments; any decision to enter into a specific transaction shall be made by the client following an assessment by him/her of their situation.
StoneX Europe Ltd makes no representation or warranty and assumes no liability as to the accuracy or completeness of the information provided, nor any loss arising from any investment based on a recommendation, forecast or other information supplied. You should always seek independent advice as to your suitability to speculate in any related markets and your ability to assume the associated risks, if you are at all unsure. We are not under any obligation to update any such material. Any opinion made may be personal to the author and may not reflect the opinion of StoneX Europe Ltd.