







Emerging Markets Pairs may be Giving Us Clues
Emerging market currencies may be telling us that stocks have moved too far, too fast!
Share this:
Many emerging market currencies (EMs) trade in the same direction as stocks. That is, many of the emerging market currency US Dollar pairs trade inversely with stocks. So, if stocks move lower, emerging market US Dollar pairs, such as the USD/MXN, USD/ZAR and USD/TRY will trade higher. With stocks bouncing off the lows over the last month, one would guess that these EM pairs have retraced their moves as well. However, that is not the case. Is there information in that?
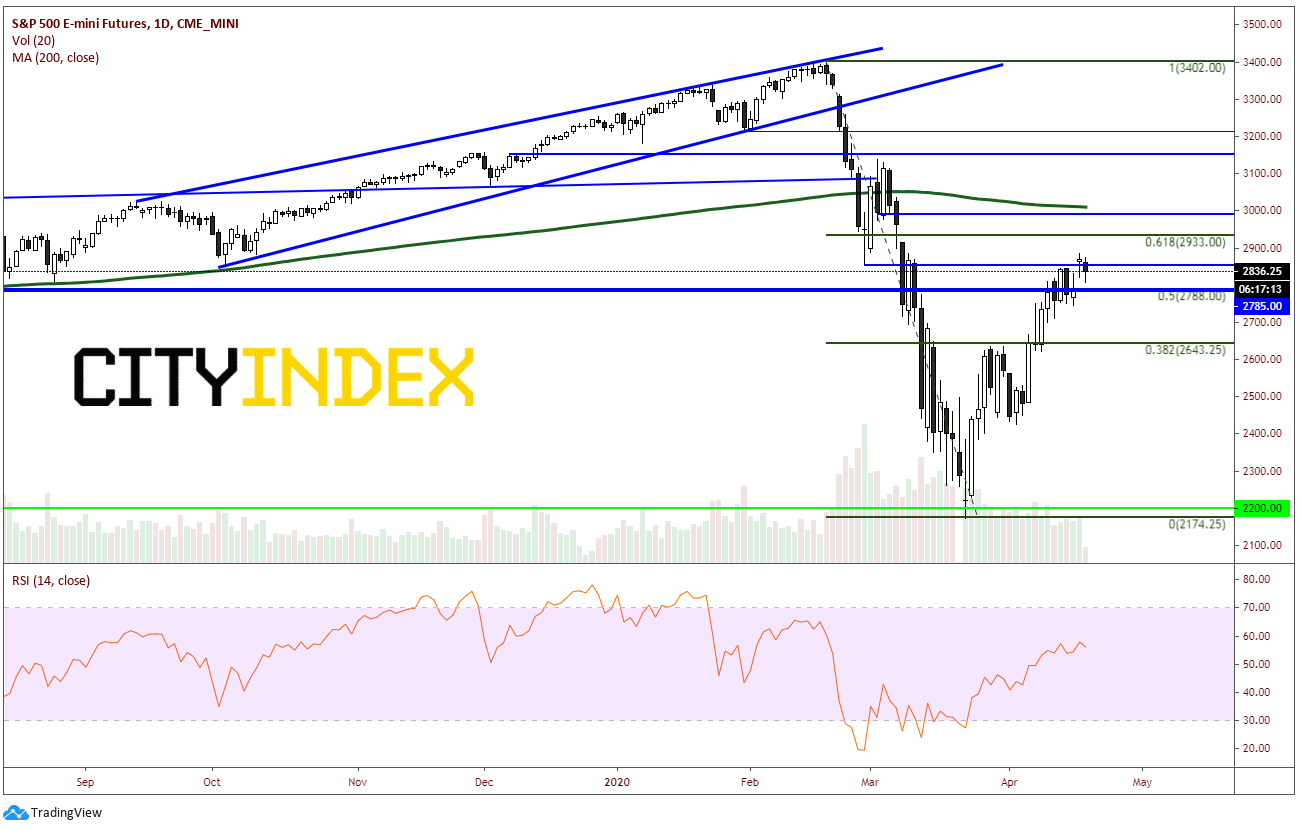
As we have seen, the S&P 500 has traded to a low of 2174.25 on March 23rd and have been trading higher since. On Friday, the Index put in a recent high of 2885, near the 61.8% Fibonacci retracement level from the all-time highs on February 20th highs to the March 23rd lows.
Source: Tradingview, CME, City Index
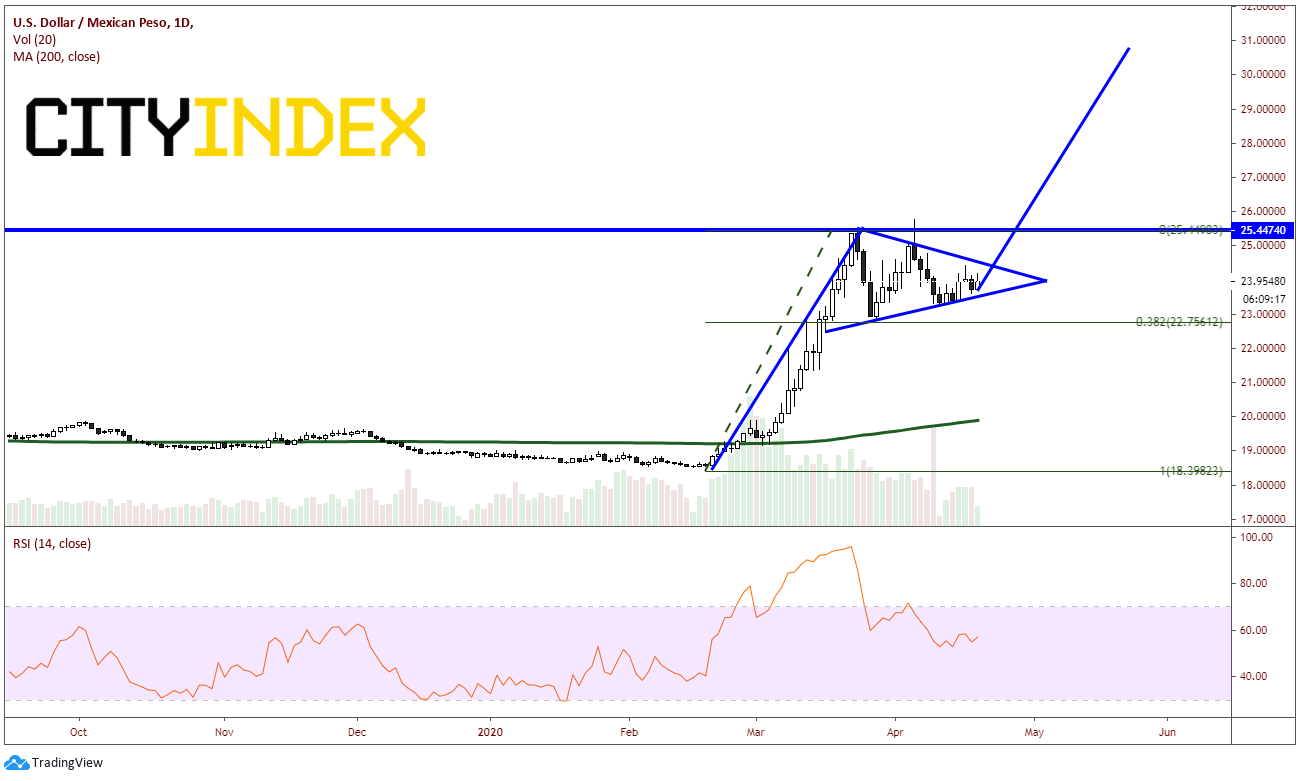
However, if we take a look at an EM pair, such as USD/MNX, the pair has only traded back to the 38.2% Fibonacci retracement level from the highs on March 24th. The pair has been consolidating sideways in a pennant formation since then. If it does break higher, the current target is above 30.00!
Source: Tradingview, City Index
Over the same February 20th to March 23rd time period, USD/ZAR only stalled for a few days before continuing its bid higher. The pair finally stopped at all-time highs of 19.339 on April 6th and has also been consolidating in a sideways more. The EM pair couldn’t even pull back to the 38.2% Fibonacci retracement level from that time frame, much less from the lows at the beginning of the move on January 2nd!
Source: Tradingview, City Index
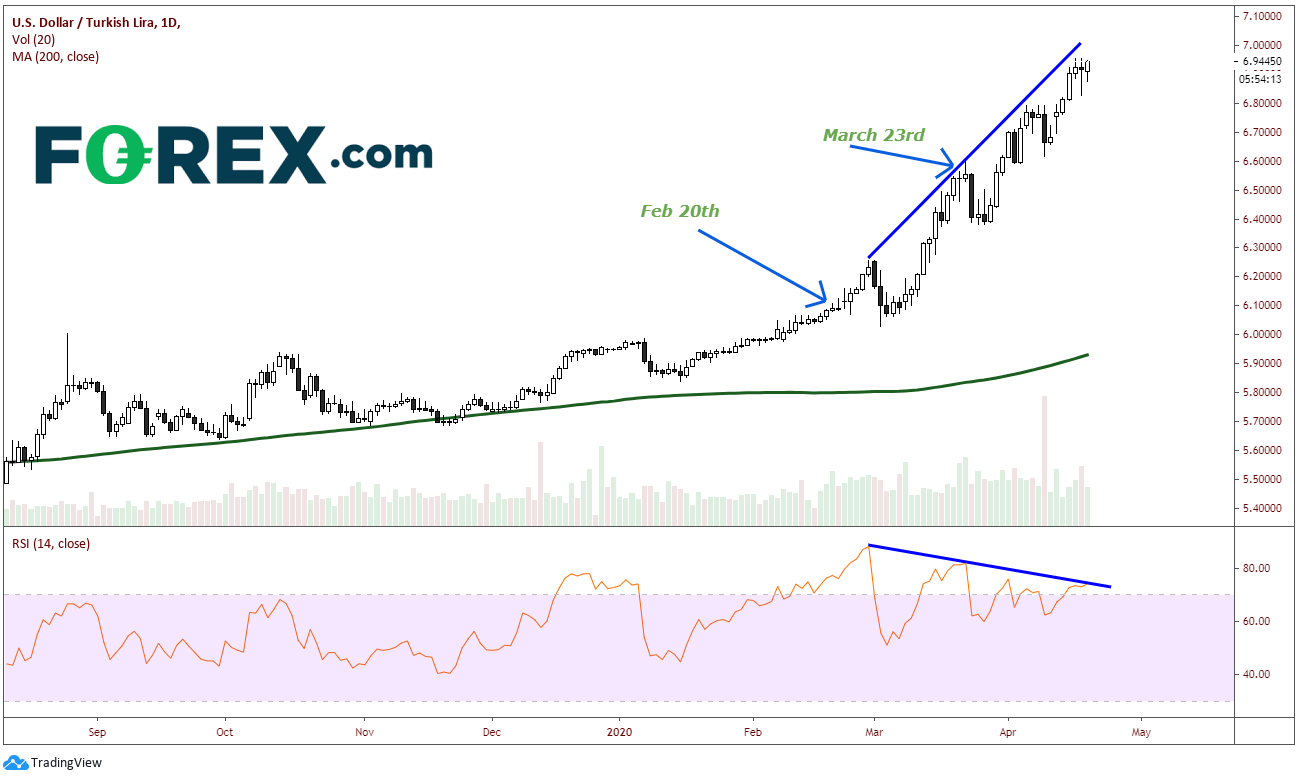
USD/TRY has been non-stop bid since the beginning of the move higher in stocks, with minor pullbacks along the way. Although the pair is diverging with the RSI and probably due for a pullback, it hasn’t yet. USD/TRY is trading near recent highs at 6.9500.
Source: Tradingview, City Index
So, what does all this mean for stocks? If we take a look at these EMs, we can see that they have only pulled back slightly, or not at all! They may even break out soon and head higher! If that happens, one would think that stocks may move lower. Emerging market currencies may be telling us that stocks have moved too far, too fast!
Many emerging market currencies (EMs) trade in the same direction as stocks. That is, many of the emerging market currency US Dollar pairs trade inversely with stocks. So, if stocks move lower, emerging market US Dollar pairs, such as the USD/MXN, USD/ZAR and USD/TRY will trade higher. With stocks bouncing off the lows over the last month, one would guess that these EM pairs have retraced their moves as well. However, that is not the case. Is there information in that?
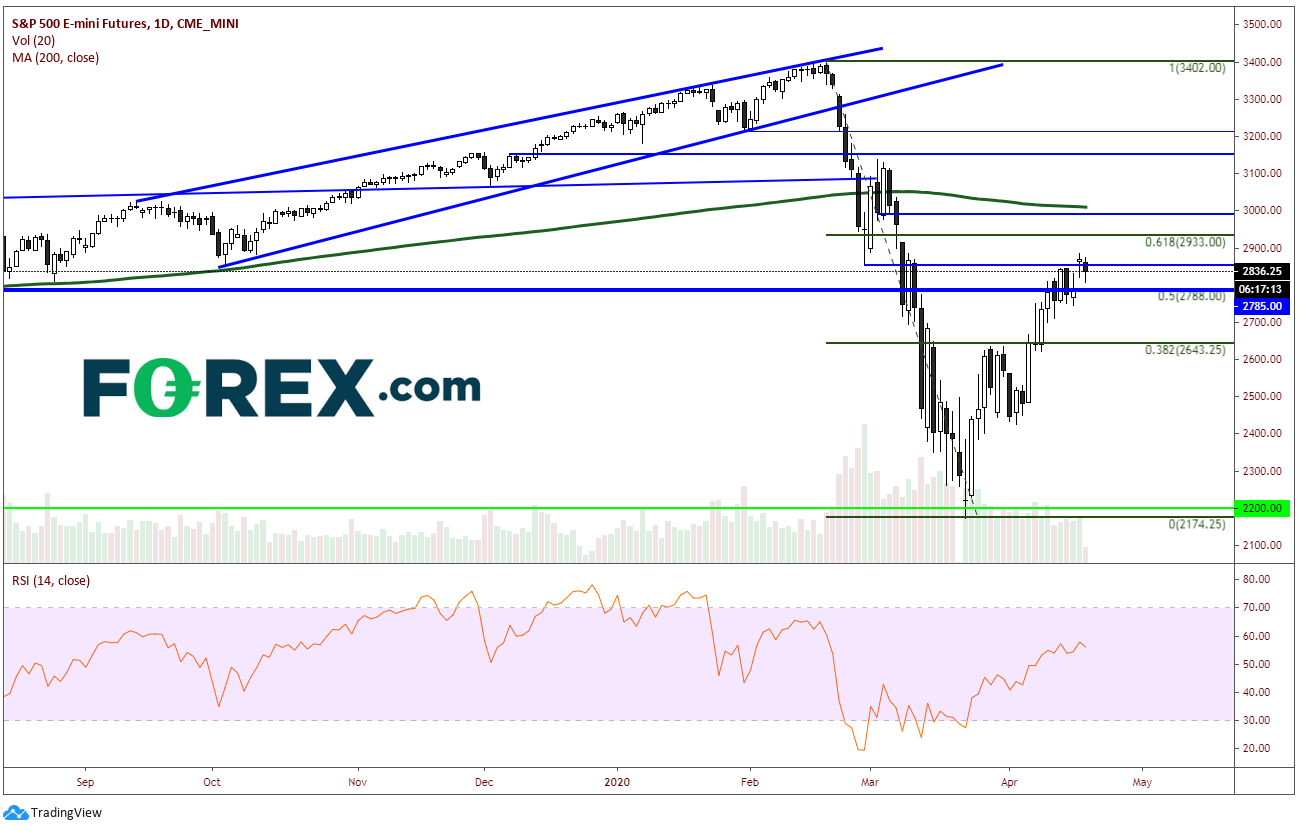
As we have seen, the S&P 500 has traded to a low of 2174.25 on March 23rd and have been trading higher since. On Friday, the Index put in a recent high of 2885, near the 61.8% Fibonacci retracement level from the all-time highs on February 20th highs to the March 23rd lows.
Source: Tradingview, CME, FOREX.com
However, if we take a look at an EM pair, such as USD/MNX, the pair has only traded back to the 38.2% Fibonacci retracement level from the highs on March 24th. The pair has been consolidating sideways in a pennant formation since then. If it does break higher, the current target is above 30.00!
Source: Tradingview, FOREX.com
Over the same February 20th to March 23rd time period, USD/ZAR only stalled for a few days before continuing its bid higher. The pair finally stopped at all-time highs of 19.339 on April 6th and has also been consolidating in a sideways more. The EM pair couldn’t even pull back to the 38.2% Fibonacci retracement level from that time frame, much less from the lows at the beginning of the move on January 2nd!
Source: Tradingview, FOREX.com
USD/TRY has been non-stop bid since the beginning of the move higher in stocks, with minor pullbacks along the way. Although the pair is diverging with the RSI and probably due for a pullback, it hasn’t yet. USD/TRY is trading near recent highs at 6.9500.
Source: Tradingview, FOREX.com
So, what does all this mean for stocks? If we take a look at these EMs, we can see that they have only pulled back slightly, or not at all! They may even break out soon and head higher! If that happens, one would think that stocks may move lower. Emerging market currencies may be telling us that stocks have moved too far, too fast!
Latest market news




The complete CFD trading experience
Award-winning platforms, competitive spreads, low commissions and dedicated support.
We live and breathe the markets and are dedicated to helping traders realise their ambitions as we continue to set the industry bar.
Economic calendar
Web Trader platform
Our sophisticated web-based platform is packed with features.
Related articles
EUR/USD weekly outlook: Oil, inflation and NFP in focus
After coming under significant pressure in recent weeks, the EUR/USD came off its lows to finish the week on a positive note on Friday, albeit with only a mild rebound. That was not enough to prevent the exchange rate falling for the third consecutive week, as the US dollar and bond yields rallied across the board.


USD/JPY Weekly Outlook: Payrolls loom as US rates remain the dominant driver
Strong US growth and hawkish Fed pricing continue to support USD/JPY, while intervention risk appears to be kicking in at lower levels

EUR/USD Q4 2026 Outlook: Euro at a Crossroads as Fed, ECB Tighten 9 25 2026
EUR/USD enters Q4 at a pivotal inflection point as competing Fed-ECB policy paths and persistent inflation risks collide with major technical support.

StoneX Europe Ltd may make third party material available on this website which may contain information included but not limited to the conditions of financial markets. The material is for information purposes only and does not contain, and should not be construed as containing, investment advice and/or investment recommendation and/or an investment research and/or an offer of or solicitation for any transactions in financial instruments; any decision to enter into a specific transaction shall be made by the client following an assessment by him/her of their situation.
StoneX Europe Ltd makes no representation or warranty and assumes no liability as to the accuracy or completeness of the information provided, nor any loss arising from any investment based on a recommendation, forecast or other information supplied. You should always seek independent advice as to your suitability to speculate in any related markets and your ability to assume the associated risks, if you are at all unsure. We are not under any obligation to update any such material. Any opinion made may be personal to the author and may not reflect the opinion of StoneX Europe Ltd.