



EUR/USD forecast: Currency Pair of the Week April 13, 2026
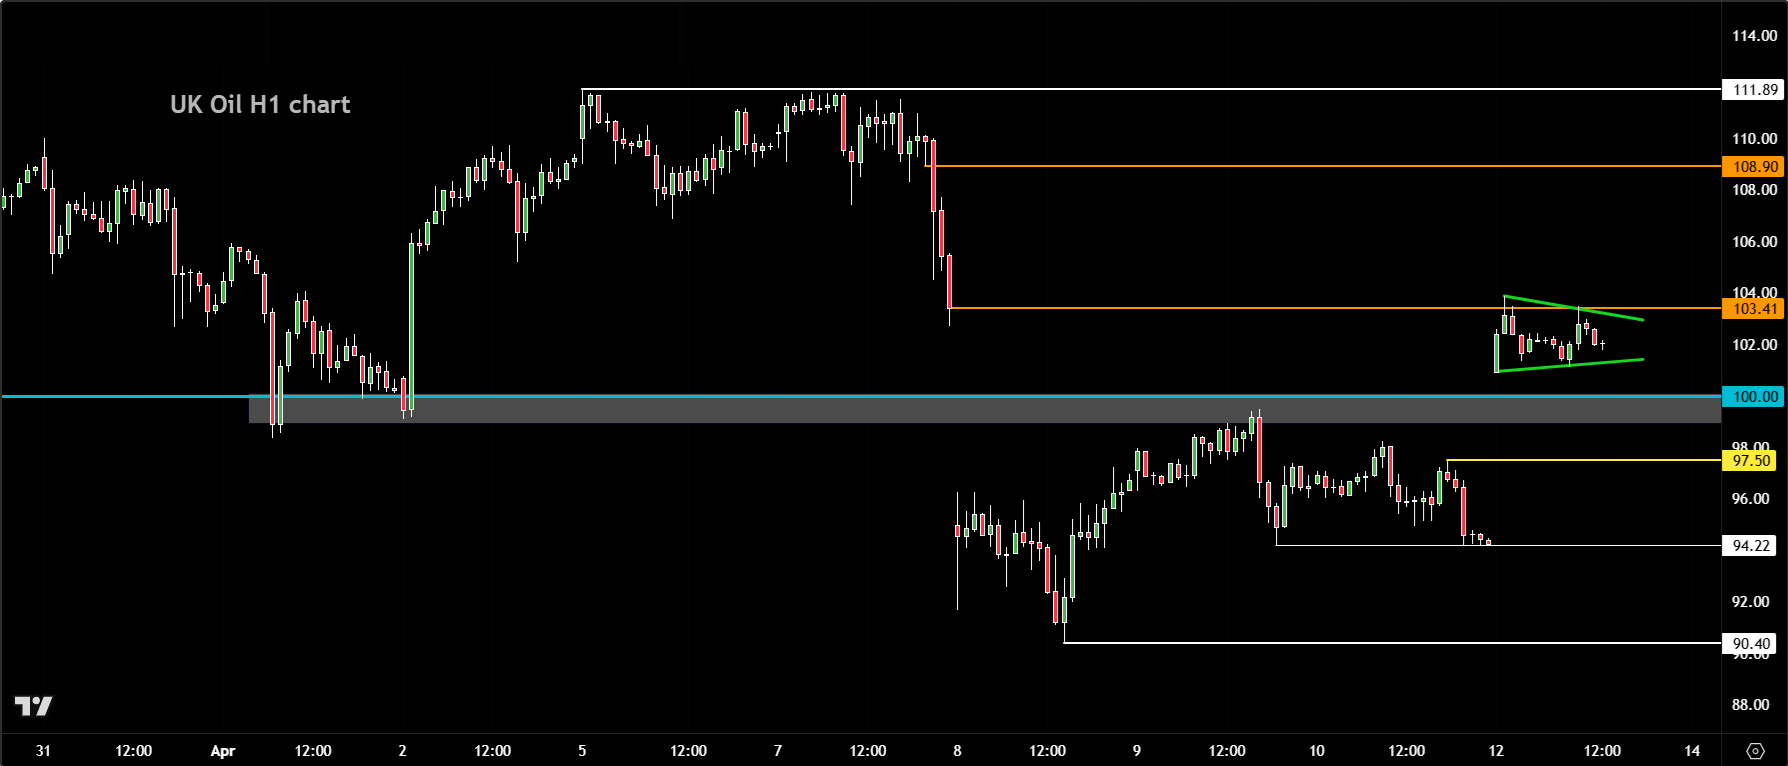
Oil’s gap back above $100 a barrel has set the tone for markets today, causing stocks, bonds, bitcoin and major foreign currencies to weaken, while bond yields and the dollar have risen. This comes after Donald Trump ordered a blockade of the Strait of Hormuz, following a weekend of stalled US-Iran peace talks.
Share this:

Oil’s gap back above $100 a barrel has set the tone for markets today, causing stocks, bonds, bitcoin and major foreign currencies to weaken, while bond yields and the dollar have risen. This comes after Donald Trump ordered a blockade of the Strait of Hormuz, following a weekend of stalled US-Iran peace talks. At the same time, traders have started to dial back expectations for a US rate cut in 2026, giving the dollar a fresh bid. Against this backdrop, the risks to our EUR/USD forecast remain tilted to downside, barring a surprise de-escalation in the situation now.
Crude oil back above $100
Though off its earlier highs, the price of crude oil remains sharply higher relative to Friday’s close. It looks like the market is bracing for another week dominated by headlines as the Strait of Hormuz remains firmly in the spotlight. Trump’s restrictions on vessels linked to Iranian ports risk tightening energy supply further, potentially amplifying what already looks like an energy shock. That said, the relatively modest pullback in risk assets suggests investors aren’t in full panic mode just yet. There’s still a sense — perhaps hopeful — that some form of resolution could emerge.
Dollar again finds support on oil spike
The latest surge in crude oil prices, alongside a noticeable uptick in US consumer prices for March, is nudging bond markets back towards an inflation-focused narrative. Trump’s announcement of US military blockade of Iran has further fuelled those fears. The US president is trying to squeeze Iran financially while nudging major buyers like China and India to lean on Tehran towards a ceasefire.
Interestingly, markets aren’t reacting more aggressively, suggesting diplomacy isn’t completely off the table. Investors are also confident that the worst-case scenario of direct, lasting damage to regional energy infrastructure has been avoided. But if those assumptions prove to be wrong, we could see a major drop in risk assets again, while crude oil could easily climb another 10-20 dollars per barrel.
So, for US dollar – and indeed, the market as a whole, attention will shift to whether the potential US blockade triggers renewed negotiations, and whether regional actors — including Iranian-backed groups — escalate tensions elsewhere. There’s also the question of how major consumers respond to any interference with supply.
Euro shows some resilience despite gap
EUR/USD took a hit in Asian trading as oil surged, but again, it could have been worse. The absence of immediate escalation in terms of infrastructure damage is likely why the pair hasn’t slipped more meaningfully yet. There’s also a bit of political support in the background for the EUR/USD forecast. Developments in Hungary — where there’s been a shift towards pro-EU sentiment — are being seen as a positive for Brussels. It may even give Eurosceptic movements elsewhere something to think about.
Technical EUR/USD forecast
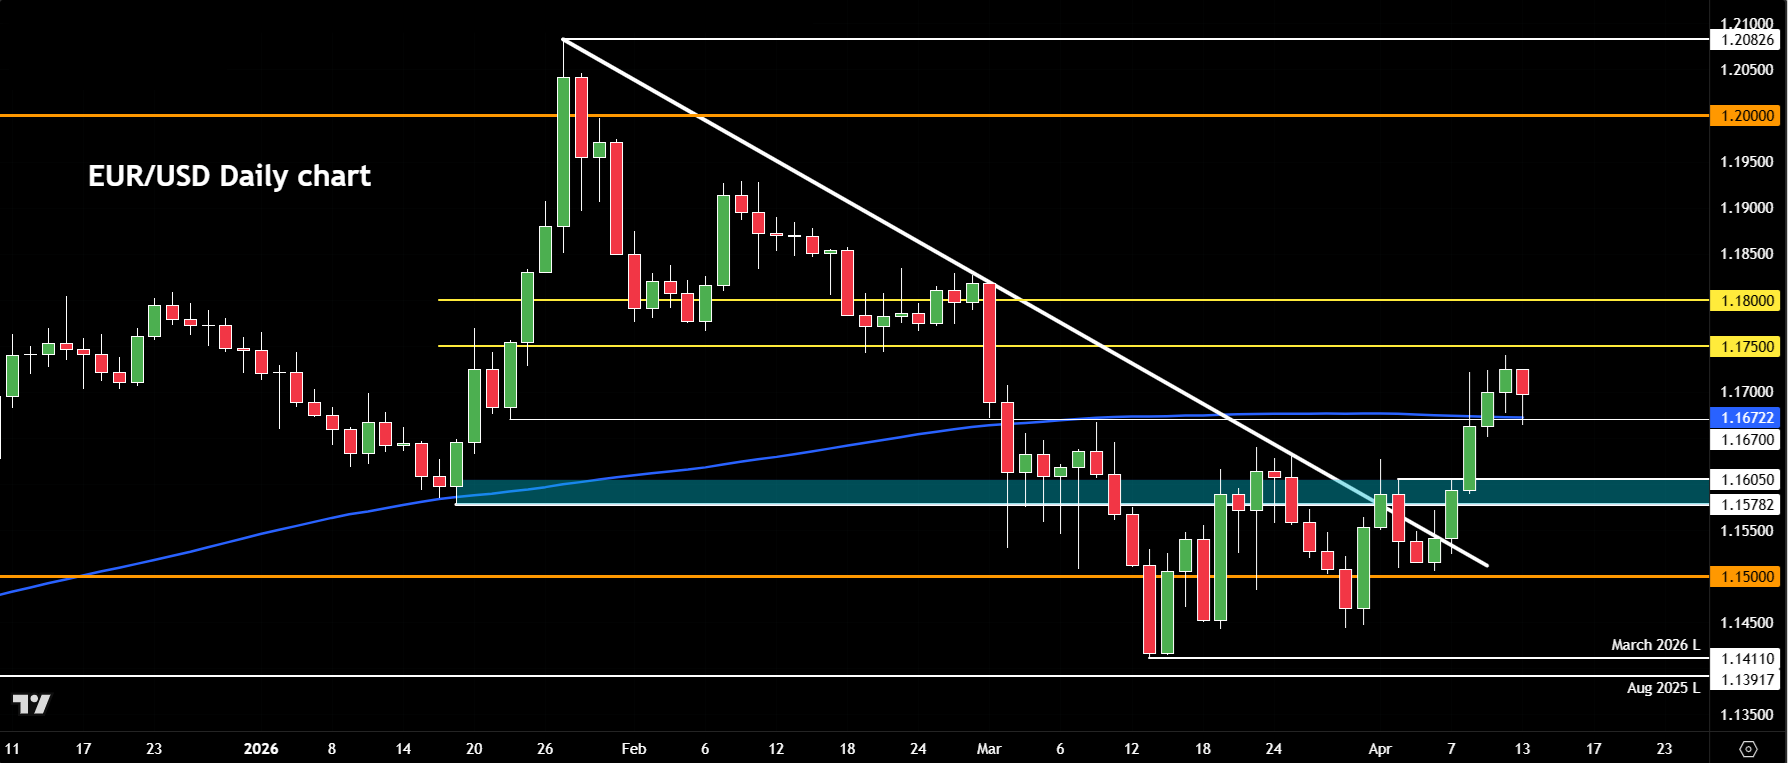
From a technical perspective, the chart for EUR/USD hasn’t changed significantly. It has managed to bounce quite strongly from those early lows, similar to what we’ve seen in the equity indices.
Now, the key question is how things develop as the session progresses.
At this stage, the gap has been mostly filled. So, the focus shifts to whether price wants to resume lower from here or push higher. So far, the market looks fairly undecided.
Because of that, it’s important to keep a close eye on key technical levels to determine the next directional move.
Key levels to watch
In the short term, support comes in around the 1.1665 to 1.1670 area. This marks a previous high and also aligns with the 200 moving average, making it an important technical level to watch. A break below this zone would tilt the bias slightly bearish.
If that happens, we could see a move down toward the 1.1578 to 1.1605 region. This area represents the origin of the previous breakout, as well as the January low that was reclaimed last week. As such, it should act as the next key support zone.
That said, the real line in the sand sits at 1.1500. A break below this level would signal a clearly bearish development for EUR/USD.
On the upside, resistance is seen around the 1.1750 to 1.1800 area. This zone corresponds to the base of the previous breakdown from late February and is likely to act as a cap in the near term.
Overall, this remains a tradable, range-bound market rather than a trending one. The strategy here is to trade from one level to the next and wait for clear opportunities, rather than anticipating a sustained trend to emerge.

-- Written by Fawad Razaqzada, Market Analyst
Follow Fawad on Twitter @Trader_F_R


The complete CFD trading experience
Award-winning platforms, competitive spreads, low commissions and dedicated support.
We live and breathe the markets and are dedicated to helping traders realise their ambitions as we continue to set the industry bar.
Economic calendar
Web Trader platform
Our sophisticated web-based platform is packed with features.
Related articles
Nikkei breakout accelerates as yen weakness returns
Nikkei has started October with a powerful breakout, helped by renewed yen weakness and strong upside momentum

AUD/USD hammered by US yields and fading RBA hike bets
US yields, dollar strength and fading RBA hike bets have combined to drive AUD/USD to fresh multi-month lows. The macro and technical bias remains bearish, although history suggests parts of the move are now reaching unusually stretched levels.

EUR/USD Forecast: Euro Struggles to Find Support Even After U.S. PCE Data
The euro continues to face a challenging environment in the short term. The currency has struggled to regain ground against a U.S. dollar that remains firmly supported, a dynamic reflected in EUR/USD, which has now recorded three consecutive losing sessions and a decline of roughly 0.6%.

StoneX Europe Ltd may make third party material available on this website which may contain information included but not limited to the conditions of financial markets. The material is for information purposes only and does not contain, and should not be construed as containing, investment advice and/or investment recommendation and/or an investment research and/or an offer of or solicitation for any transactions in financial instruments; any decision to enter into a specific transaction shall be made by the client following an assessment by him/her of their situation.
StoneX Europe Ltd makes no representation or warranty and assumes no liability as to the accuracy or completeness of the information provided, nor any loss arising from any investment based on a recommendation, forecast or other information supplied. You should always seek independent advice as to your suitability to speculate in any related markets and your ability to assume the associated risks, if you are at all unsure. We are not under any obligation to update any such material. Any opinion made may be personal to the author and may not reflect the opinion of StoneX Europe Ltd.