



EUR/USD Outlook: Hormuz tensions tilt risks back to the downside
Markets are back to playing headline hockey as the US resumes strikes on Iran. That may not trigger an immediate plunge in EUR/USD, but it does leave the balance of risks skewed to the downside.
Share this:
- Fresh US strikes reignite Hormuz disruption fears
- Europe's energy vulnerability back in focus
- Euro and European cyclicals resume underperforming
- Bearish wedge points to renewed downside risk
Back to pricing energy risk
The US has resumed strikes on Iran after attacks on commercial shipping transiting the Strait of Hormuz, raising the prospect that markets may once again have to price the risk of prolonged disruption to one of the world's most important energy chokepoints.
As Donald Trump declares the memorandum of understanding signed only weeks ago between the US and Iran "over", so too may be the brief respite for the euro, reviving simmering fears over energy security.
While it's too early to know whether the Strait will face prolonged disruption, the prospect alone is enough to remind investors that the region remains far more exposed to Middle Eastern energy shocks than the United States.
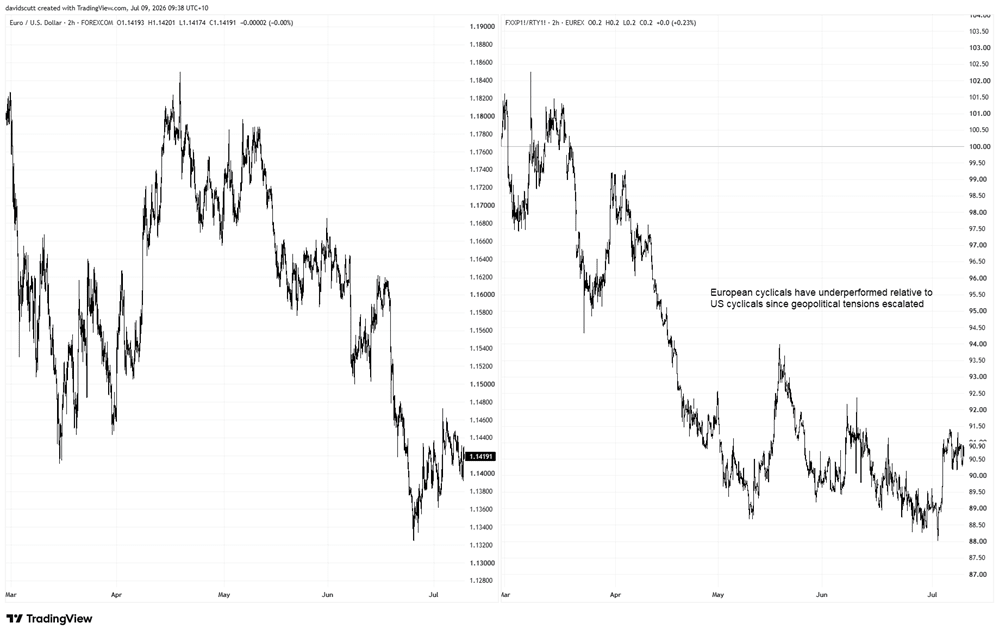
Even if higher energy prices increase the odds of another ECB rate hike later this month, the potential hit to growth may prove the more important driver, tilting the balance of risks for the euro and European assets to the downside, as shown in the chart below.
Europe left behind
Source: TradingView
The left-hand panel tracks EUR/USD since the Friday before the initial US strikes on Iran in late February. Alongside it is the performance of Euro Stoxx 600 futures relative to Russell 2000 futures over the same period. The latter were chosen because both are broader, more cyclical equity benchmarks, avoiding the outsized influence that mega-cap tch companies exert on US indices such as the S&P 500 and Nasdaq.
Since the conflict began, the euro has weakened while European equities have generally underperformed comparable US peers. To be sure, geopolitics is far from the only driver behind that divergence, but Europe's greater reliance on imported energy makes it far more vulnerable, impacting economic sentiment and capital flows.
However, while Trump's declaration that the MOU is "over" has revived geopolitical risk, traders are unlikely to price in the worst case scenario immediately. Throughout the conflict, markets have repeatedly lurched between reports of imminent de-escalation and renewed hostilities, whether from Trump himself or sources familiar with the negotiations.
The prolonged whipsawing may temper any immediate knee-jerk reaction, with trader instead likely to demand clearer evidence that the latest escalation will have a lasting impact on energy supplies and European economy. Rather than a single sharp move, EUR/USD may instead be vulnerable to a gradual grind lower, punctuated by bouts of volatility as markets once again find themselves playing headline hockey.
Technicals and fundamentals align
Source: TradingView
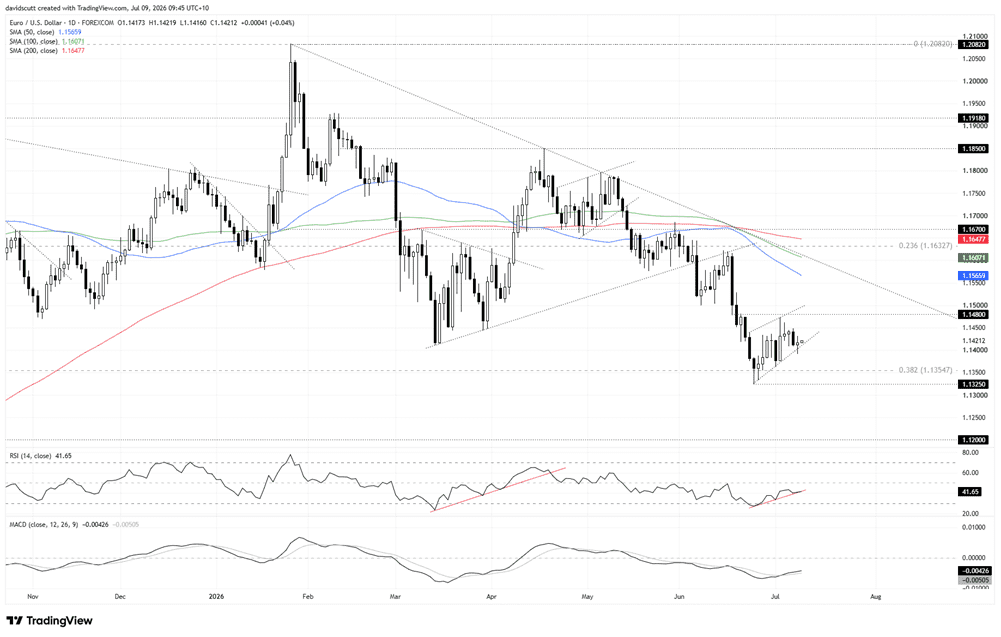
When you zoom out, the price action continues to favour the bears with EUR/USD carving out a series of lower highs and lower lows. It also remains beneath its key medium and longer-term moving averages, all of which are now starting to roll over and carry a negative slope.
And when you zoom in, the price appears to be sitting in what resembles a rising wedge, a pattern typically associated with bearish continuation. Admittedly, the structure isn't the cleanest, but a sustained break beneath wedge support would increase the risk of a retest of the lows set in June, and potentially an extension of the broader bearish trend.
If that scenario were to unfold, the first level to watch is the 38.2% Fibonacci retracement of the April 2025 advance at 1.1355, followed by the June 24 swing low at 1.1325. Should that latter level give way, there's not a lot of meaningful technical support to speak of until 1.1200, an area that repeatedly influenced price action following the Liberation Day tariff announcement in April 2025.
On the topside, the pair has repeatedly struggled above 1.1450, with another minor resistance zone sitting around 1.1480. Above there, 1.1500 and 1.1566 are the levels to watch.
The story from the oscillators is one of diminishing downside strength, not building upside momentum. RSI has lifted from oversold territory but, at around 42, remains below the midpoint and looks close to breaking the very shallow uptrend it's been sitting in over recent weeks. MACD has crossed above its signal line, but that merely suggests downside momentum has eased rather than been eradicated altogether. For now, that continues to favour selling into strength.
Latest market news



The complete CFD trading experience
Award-winning platforms, competitive spreads, low commissions and dedicated support.
We live and breathe the markets and are dedicated to helping traders realise their ambitions as we continue to set the industry bar.
Economic calendar
Web Trader platform
Our sophisticated web-based platform is packed with features.
Related articles
US Dollar, GBP/USD, USD/CAD, USD/CHF, Gold Weekly Technical Outlook 11 2 2026
Sr. Technical Strategist Michael Boutros highlights the levels that matter on the USD Majors, commodities, and equity indices charts this week.

US Midterm Forecast: The Key Risks for Traders to Watch Through the US Elections
Prediction markets are pricing in nearly 75% odds of a Democratic sweep in this week’s US midterm elections, a development that would result in a split from the single party Republican rule of the past two years - what will it mean for markets?

Gold forecast: XAU/USD stabilised after recent falls – for now
Gold has started the first week of the new month trying to recover some ground after another bruising week. Oil prices have taken a sharp drop and that has allowed risk assets to bounce back, which has clearly helped the precious metal too. However, with sentiment remaining bearish towards the metals, and with $4000 level having been taken out last week, the path of least resistance is to the downside for gold.

StoneX Europe Ltd may make third party material available on this website which may contain information included but not limited to the conditions of financial markets. The material is for information purposes only and does not contain, and should not be construed as containing, investment advice and/or investment recommendation and/or an investment research and/or an offer of or solicitation for any transactions in financial instruments; any decision to enter into a specific transaction shall be made by the client following an assessment by him/her of their situation.
StoneX Europe Ltd makes no representation or warranty and assumes no liability as to the accuracy or completeness of the information provided, nor any loss arising from any investment based on a recommendation, forecast or other information supplied. You should always seek independent advice as to your suitability to speculate in any related markets and your ability to assume the associated risks, if you are at all unsure. We are not under any obligation to update any such material. Any opinion made may be personal to the author and may not reflect the opinion of StoneX Europe Ltd.