






Eurozone climbing into the higher inflation boat EURUSD
Will the ECB reduce bond purchases, do nothing, or even increase them due to higher inflation?
Share this:

Earlier, the Eurozone released its Producer Price Index (PPI) data for APRIL, which was 1%, vs an expectation of 0.5% and 1.1% in March. No big deal, right? Old data. But theoretically, PPI feeds in the Consumer Price Index (CPI) in subsequent months. On Tuesday, the Eurozone released its CPI data for MAY. (Why they release April PPI after May CPI, I have no idea!). May’s CPI reading was 2%. This is the highest reading since October 2018. The ECB has a target inflation of just below 2%. However, as with the US Fed, the ECB assumes the inflation is due to base effects (which is probably true, given where the economy was last year) and temporary factors (aka transitory).
Looking further into inflation, the IHS Markit Eurozone Manufacturing PMI was also released earlier this week. The reading for May was 63.1, the highest ever. Similar to the US, which we discussed in the Currency Pair of the Week, the EU is having a big supply chain issue. As a result of increased demand and lower supply, prices are rising. The output inflation was the highest in 18 years! The ECB meets next week. Recall that at the March meeting, the ECB increased the pace of their bond buying. The question that traders will be looking for an answer to is “Will the ECB cut back on the pace of bond buying to pre-March levels, increase it to try and lower inflation, or keep it unchanged?”
Everything you need to know about the ECB
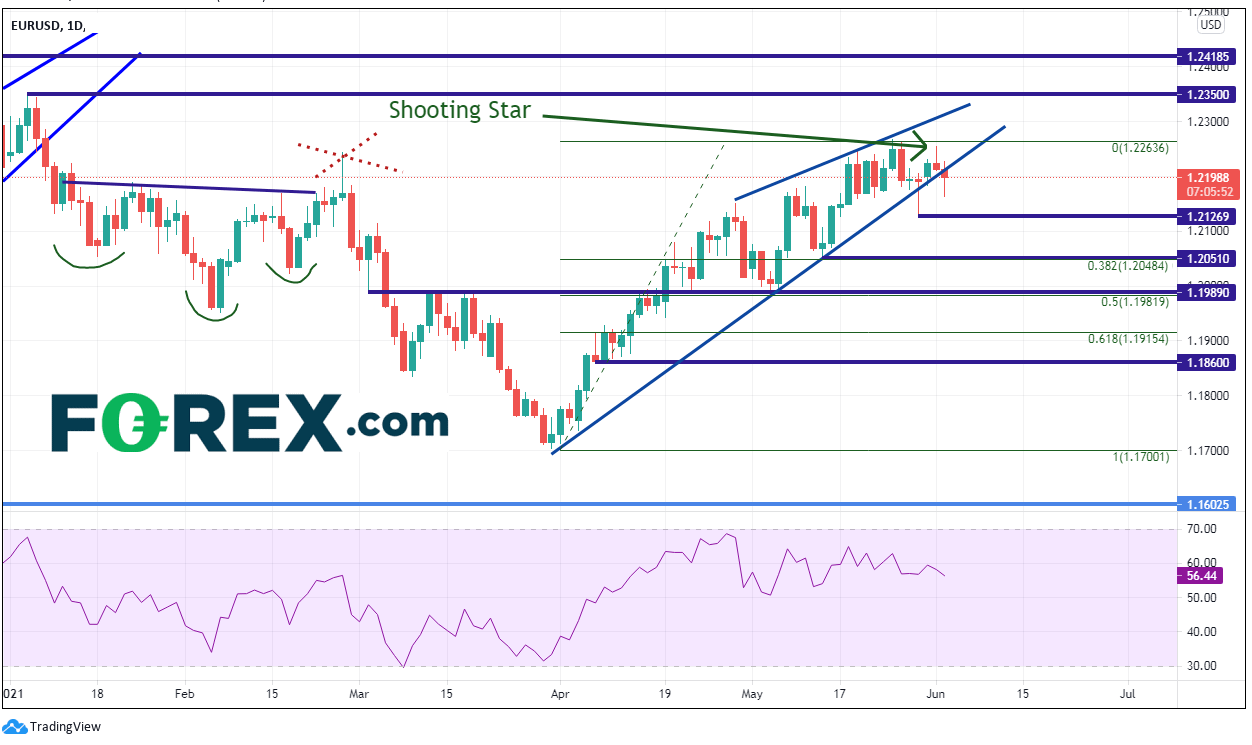
EUR/USD formed a shooting star candlestick on a daily timeframe. We discussed shooting stars in our most recent webinar on candlestick patterns and how they tend to be 1-day reversal patterns. Today, price broke lower below the bottom trendline of an ascending wedge, which was discussed in our webinar last week on Chart Patterns. Last Friday, price had a false breakout below the wedge. Can it happen twice within 4 days?
Source: Tradingview, City Index
On a 240-minute timeframe, after breaking the trendline, EUR/USD held the 38.2% Fibonacci retracement from the May 5th lows to the May 28th highs near 1.2159. The pair also formed a bullish candlestick formation. Typically, the longer-term daily shooting star would trump a short-term hammer. Thus far, EUR/USD is holding the upward sloping trendline. The next resistance above the near-term trendline is between 1.2245 (early Jan highs) and 1.2267 (May 25th highs). Above there, resistance is at 1.2419, the highs from April 2018! Support below the 38.2% Fibonacci retracement is at the May 28th lows of 1.2133 and the 50% retracement level from the same timeframe near 1.2161. Below there is the 61.8% Fibonacci retracement at 1.2093.
Source: Tradingview, City Index
With the higher inflation data from the EU, the ECB is going to have a tough decision on its hands when they meet next week. Will they reduce bond purchases, do nothing, or even increase them due to higher inflation?
Learn more about forex trading opportunities.
Earlier, the Eurozone released its Producer Price Index (PPI) data for APRIL, which was 1%, vs an expectation of 0.5% and 1.1% in March. No big deal, right? Old data. But theoretically, PPI feeds in the Consumer Price Index (CPI) in subsequent months. On Tuesday, the Eurozone released its CPI data for MAY. (Why they release April PPI after May CPI, I have no idea!). May’s CPI reading was 2%. This is the highest reading since October 2018. The ECB has a target inflation of just below 2%. However, as with the US Fed, the ECB assumes the inflation is due to base effects (which is probably true, given where the economy was last year) and temporary factors (aka transitory).
Looking further into inflation, the IHS Markit Eurozone Manufacturing PMI was also released earlier this week. The reading for May was 63.1, the highest ever. Similar to the US, which we discussed in the Currency Pair of the Week, the EU is having a big supply chain issue. As a result of increased demand and lower supply, prices are rising. The output inflation was the highest in 18 years! The ECB meets next week. Recall that at the March meeting, the ECB increased the pace of their bond buying. The question that traders will be looking for an answer to is “Will the ECB cut back on the pace of bond buying to pre-March levels, increase it to try and lower inflation, or keep it unchanged?”
Everything you need to know about the ECB
EUR/USD formed a shooting star candlestick on a daily timeframe. We discussed shooting stars in our most recent webinar on candlestick patterns and how they tend to be 1-day reversal patterns. Today, price broke lower below the bottom trendline of an ascending wedge, which was discussed in our webinar last week on Chart Patterns. Last Friday, price had a false breakout below the wedge. Can it happen twice within 4 days?
Source: Tradingview, FOREX.com
On a 240-minute timeframe, after breaking the trendline, EUR/USD held the 38.2% Fibonacci retracement from the May 5th lows to the May 28th highs near 1.2159. The pair also formed a bullish candlestick formation. Typically, the longer-term daily shooting star would trump a short-term hammer. Thus far, EUR/USD is holding the upward sloping trendline. The next resistance above the near-term trendline is between 1.2245 (early Jan highs) and 1.2267 (May 25th highs). Above there, resistance is at 1.2419, the highs from April 2018! Support below the 38.2% Fibonacci retracement is at the May 28th lows of 1.2133 and the 50% retracement level from the same timeframe near 1.2161. Below there is the 61.8% Fibonacci retracement at 1.2093.
Source: Tradingview, FOREX.com
With the higher inflation data from the EU, the ECB is going to have a tough decision on its hands when they meet next week. Will they reduce bond purchases, do nothing, or even increase them due to higher inflation?
Learn more about forex trading opportunities.
Related tags:


The complete CFD trading experience
Award-winning platforms, competitive spreads, low commissions and dedicated support.
We live and breathe the markets and are dedicated to helping traders realise their ambitions as we continue to set the industry bar.
Economic calendar
Web Trader platform
Our sophisticated web-based platform is packed with features.
Related articles
Nikkei breakout accelerates as yen weakness returns
Nikkei has started October with a powerful breakout, helped by renewed yen weakness and strong upside momentum

AUD/USD hammered by US yields and fading RBA hike bets
US yields, dollar strength and fading RBA hike bets have combined to drive AUD/USD to fresh multi-month lows. The macro and technical bias remains bearish, although history suggests parts of the move are now reaching unusually stretched levels.

EUR/USD Forecast: Euro Struggles to Find Support Even After U.S. PCE Data
The euro continues to face a challenging environment in the short term. The currency has struggled to regain ground against a U.S. dollar that remains firmly supported, a dynamic reflected in EUR/USD, which has now recorded three consecutive losing sessions and a decline of roughly 0.6%.

StoneX Europe Ltd may make third party material available on this website which may contain information included but not limited to the conditions of financial markets. The material is for information purposes only and does not contain, and should not be construed as containing, investment advice and/or investment recommendation and/or an investment research and/or an offer of or solicitation for any transactions in financial instruments; any decision to enter into a specific transaction shall be made by the client following an assessment by him/her of their situation.
StoneX Europe Ltd makes no representation or warranty and assumes no liability as to the accuracy or completeness of the information provided, nor any loss arising from any investment based on a recommendation, forecast or other information supplied. You should always seek independent advice as to your suitability to speculate in any related markets and your ability to assume the associated risks, if you are at all unsure. We are not under any obligation to update any such material. Any opinion made may be personal to the author and may not reflect the opinion of StoneX Europe Ltd.