




EURUSD and DXY Consolidate Near Key Levels Ahead of CPI Report
EURUSD, DXY Outlook: With the U.S. dollar holding firm near the 99 resistance, and EURUSD under pressure around 1.16, both pairs are tracing short-term consolidations that may define the next breakout. Markets expect sticky US inflation, keeping price action confined within these tight ranges.
Share this:

Key Events
- U.S. CPI expectations remain steady at 3.1% y/y, and are unlikely to shift rate-cut sentiment, keeping DXY and EURUSD consolidating near key technical levels.
- Haven sentiment remains supported amid U.S.–China trade uncertainty and the ongoing U.S. government shutdown.
Earlier this week, Canadian inflation came in slightly higher, stabilizing USDCAD below the 1.4080 resistance. Now, attention shifts to the U.S. CPI data, where markets are also anticipating a sticky print. Expectations for weak labor market data have also kept traders cautious, maintaining both EURUSD and DXY in consolidation near critical breakout zones that could define the next directional move.
Potential catalysts include CPI results, Fed remarks, updates on the U.S. government shutdown, and tariff developments.
Technical Analysis: Quantifying Uncertainties
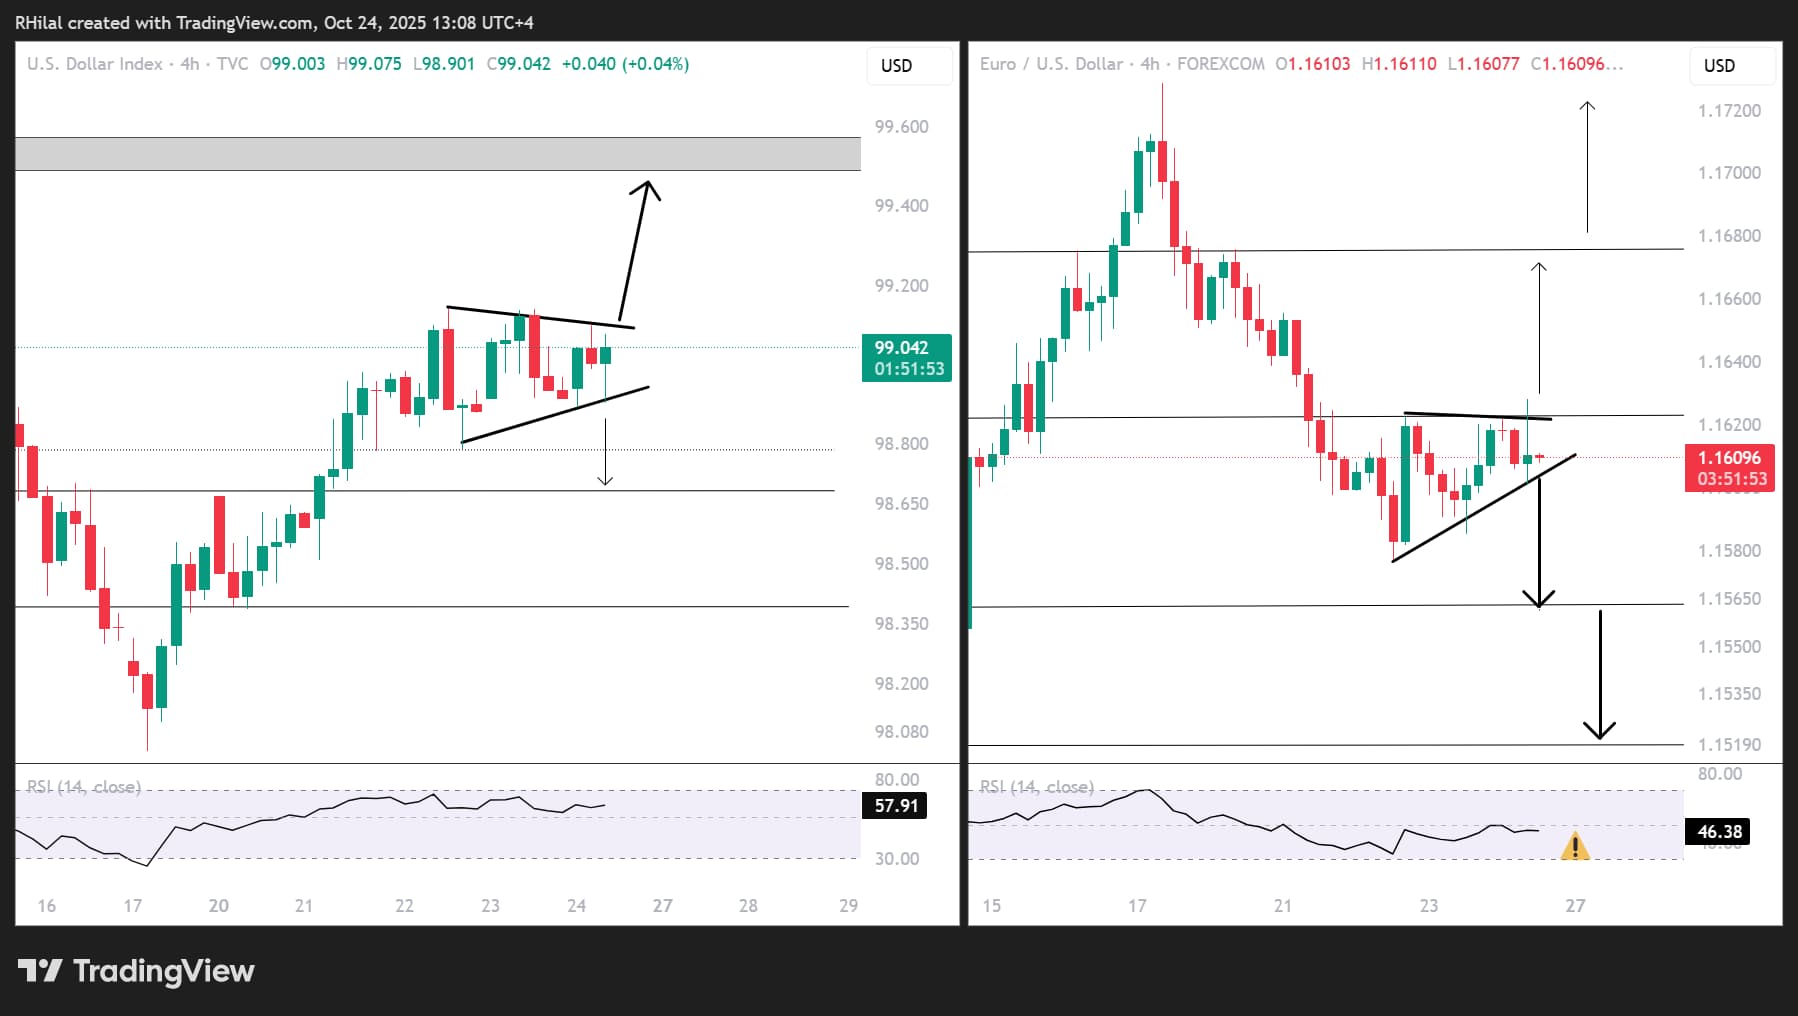
EURUSD & DXY Charts : 4-Hour Time Frames – Log Scale
Source: Tradingview
On the 4-hour chart, both DXY and EURUSD are consolidating near key levels, with DXY leaning bullish and EURUSD leaning bearish.
DXY Outlook
A breakout above 99.15 could redirect gains toward 99.50, setting up another test before confirming a move higher toward 100.20, 101, and 103.
On the downside, a hold below 98.80 could extend losses toward 98.60 and 98.40.
EURUSD Outlook
A breakout below 1.1600–1.1560 could extend the decline toward 1.1520, with deeper losses possible toward 1.1480 and 1.1380.
From the upside, holding above 1.1620 may allow a rebound toward 1.1680 and 1.1730, before targeting yearly highs if momentum builds further.
Now let’s zoom out for the higher time frame analysis
DXY Outlook: Weekly Time Frame – Log Scale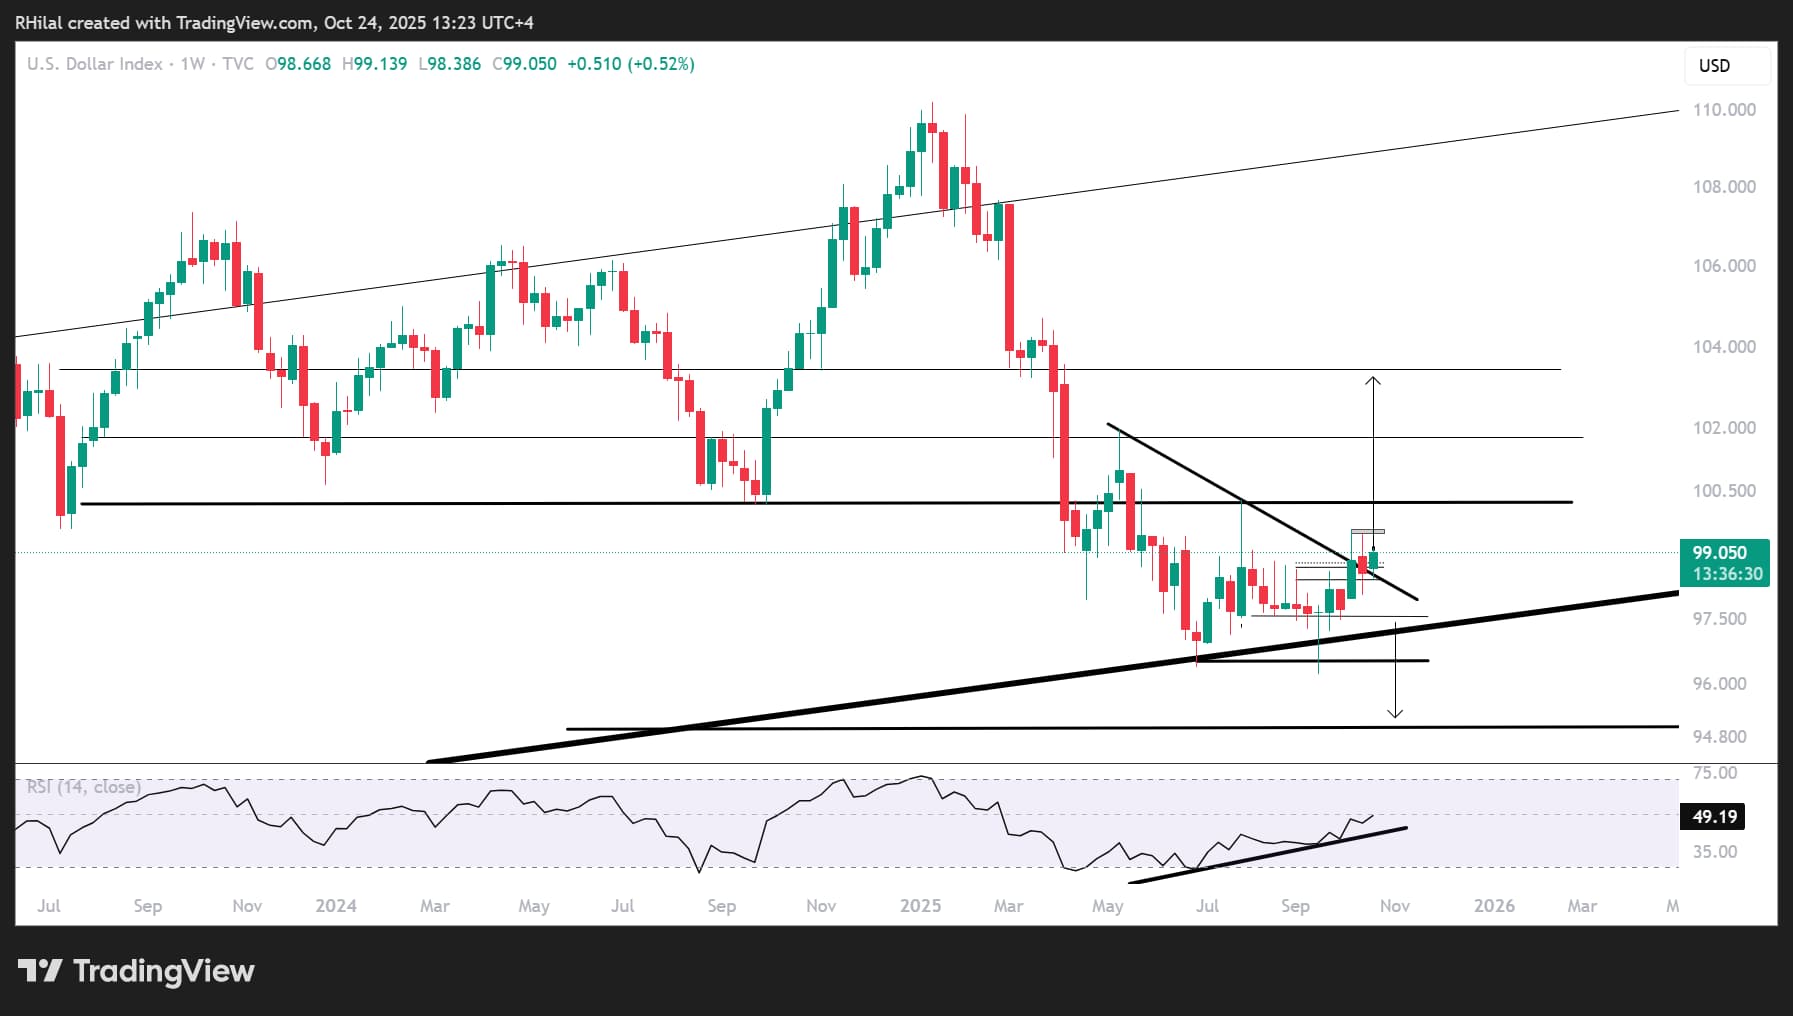
Source: Tradingview
From a weekly perspective, the DXY appears to be forming a potential inverted head and shoulders pattern, supported by a positive divergence on the weekly RSI from oversold levels last seen in August 2024.
Price action is attempting to confirm a neckline breakout, which coincides with the consolidation area seen on the 4-hour chart. A breakout above that neckline could trigger a rally toward the 103-target of the pattern. However, the 100.20 level remains a critical resistance — a region that previously acted as strong support between July 2023 and September 2024.
On the downside, the 2025 lows align with a 17-year support trendline connecting higher lows since 2008, near 96. A break below that level could expose a drop towards the 2021 lows aligning with the lower 90s price range.
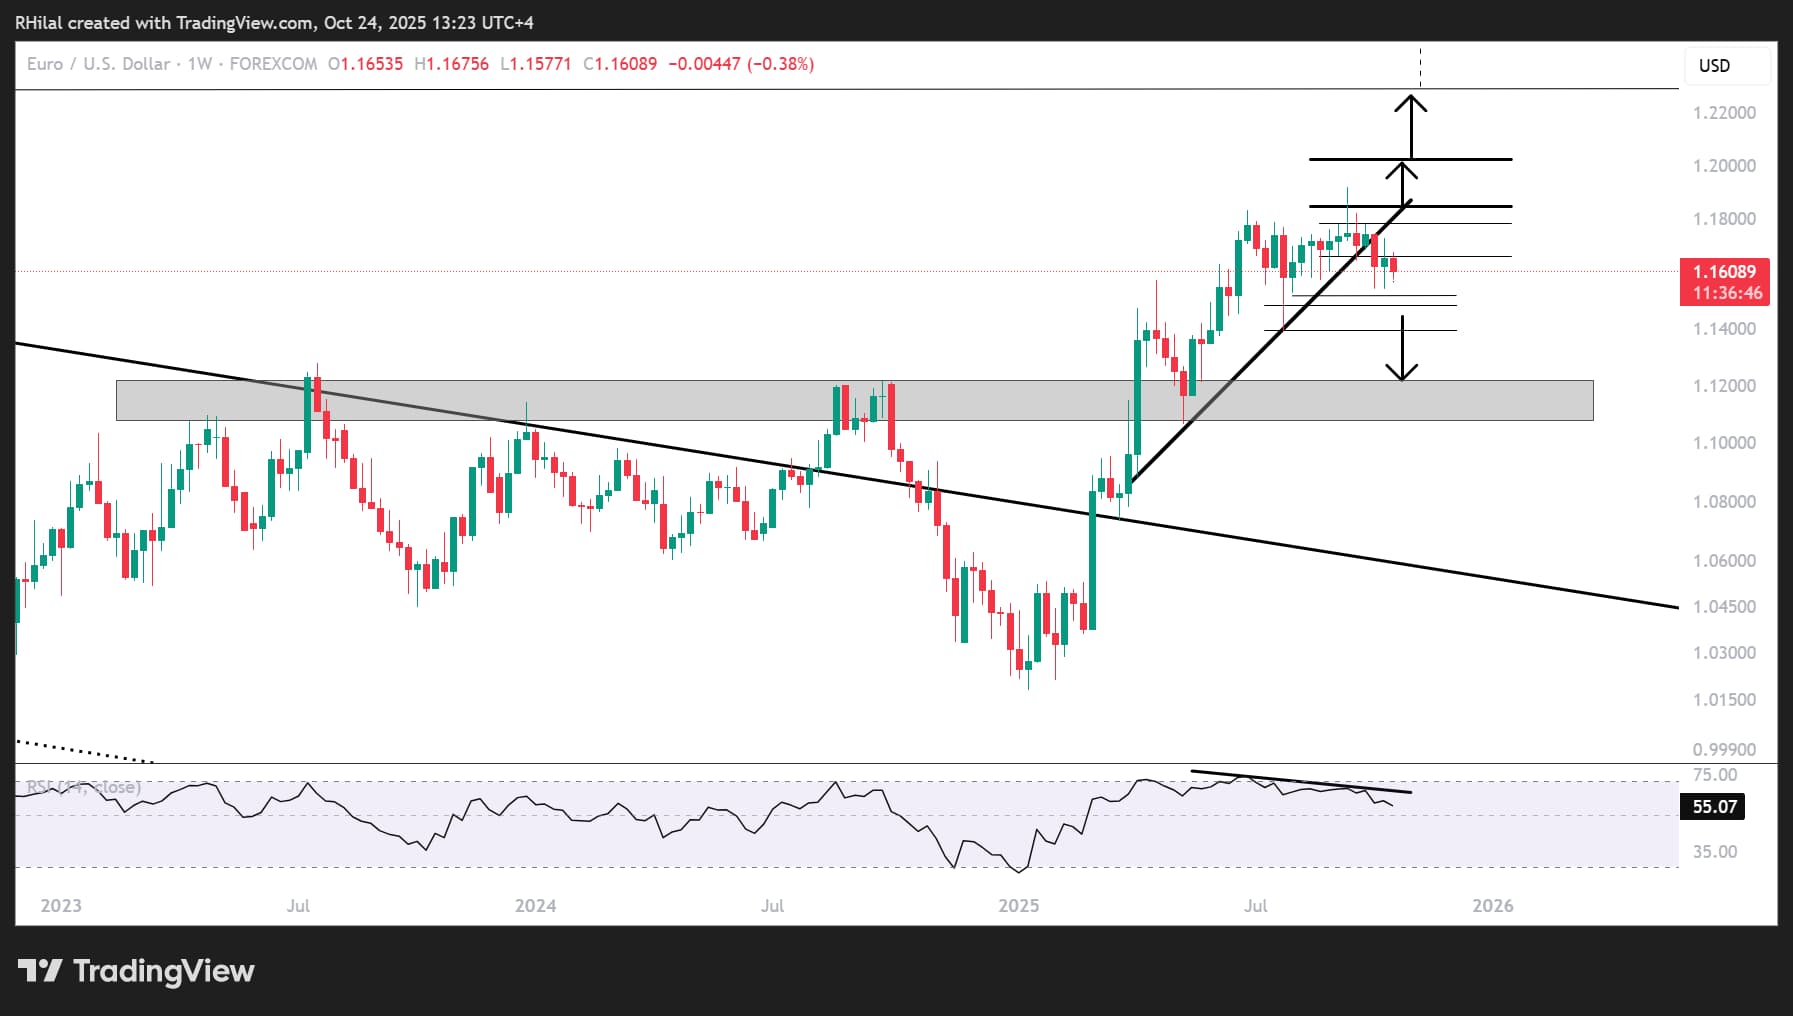
EURUSD Outlook: Daily Time Frame – Log Scale
 Source: Tradingview
For EURUSD, the structure mirrors an inverse scenario, with a head and shoulders pattern forming just above the 4-hour consolidation zone, alongside a negative RSI divergence from overbought levels last seen in August 2024.
A clean break below the neckline could confirm a deeper drop, targeting the previous resistance zone from January 2023 to September 2024 around 1.12, if 1.1480 and 1.1380 fail to hold.
Conversely, a recovery above the neckline and key levels 1.1680, 1.1730, and 1.1840 would be needed to shift bias back toward 2021 highs and 2025 records at 1.20 and 1.23.
Written by Razan Hilal, CMT
Follow on X: @Rh_waves
Related tags:

The complete CFD trading experience
Award-winning platforms, competitive spreads, low commissions and dedicated support.
We live and breathe the markets and are dedicated to helping traders realise their ambitions as we continue to set the industry bar.
Economic calendar
Web Trader platform
Our sophisticated web-based platform is packed with features.
Related articles

EUR/USD forecast remains tilted lower with French bond troubles ahead of US jobs report
The EUR/USD has tagged a fresh year-to-date low as French public-finance concerns trigger a government bond sell-off. Today's US jobs report may change little, with resilient activity, elevated energy prices and hawkish Fed bets keeping the greenback supported. With the pair trapped below resistance at 1.1410, the risk to the near-term EUR/USD forecast is tilted to the downside.


What Stretched 10-Year Yields Mean for Major Currency Pairs in Q4
U.S. 10-year Treasury yields are nearing a long-term resistance zone with overbought RSI readings, raising near-term pullback risk for the dollar.

USD/CAD shooting star puts September surge on notice
USD/CAD has printed a clear bearish reversal pattern after an extraordinary September surge, but confirmation may depend heavily on how US Treasury yields react to Friday’s payrolls report.

StoneX Europe Ltd may make third party material available on this website which may contain information included but not limited to the conditions of financial markets. The material is for information purposes only and does not contain, and should not be construed as containing, investment advice and/or investment recommendation and/or an investment research and/or an offer of or solicitation for any transactions in financial instruments; any decision to enter into a specific transaction shall be made by the client following an assessment by him/her of their situation.
StoneX Europe Ltd makes no representation or warranty and assumes no liability as to the accuracy or completeness of the information provided, nor any loss arising from any investment based on a recommendation, forecast or other information supplied. You should always seek independent advice as to your suitability to speculate in any related markets and your ability to assume the associated risks, if you are at all unsure. We are not under any obligation to update any such material. Any opinion made may be personal to the author and may not reflect the opinion of StoneX Europe Ltd.