



EURUSD and Gold Slide Ahead of FOMC Minutes
EURUSD and gold are sliding ahead of the FOMC minutes, as the DXY reclaims strength above the 97 mark, keeping key levels in focus to assess the sustainability of these pullbacks.
Share this:

Key Events
• FOMC minutes loom following stronger NFP data and softer CPI readings, supporting the DXY above 97
• Market risk sentiment remains cautious amid AI turbulence, geopolitical uncertainty, and expectations of prolonged rate holds
• The dollar’s hold near 97 pressured EURUSD below 1.1850 and gold back toward the 4,900 zone
CME fed watch tool

Despite moderating U.S. inflation and stronger-than-expected labor data, market odds for a March rate cut remain low. According to the CME FedWatch Tool, expectations for rate cuts begin to increase toward June 2026.
Recent CPI data showed inflation continuing to ease toward the Federal Reserve’s 2% target, with CPI m/m at 0.2% and CPI y/y at 2.4%. Meanwhile, January NFP surprised to the upside, with payrolls rising by 130,000 and unemployment edging down to 4.3%. This combination reinforces expectations that policymakers may keep rates elevated for longer.

This positioning has supported the DXY above its long-term 18-year support zone at 95–96, pushing it back toward 97. As a result, EURUSD slipped below the 1.1850 area, while gold retreated toward 4,900, placing key technical levels under scrutiny to confirm whether these moves are temporary pullbacks or the start of deeper corrections.
Technical Analysis: Quantifying Uncertainty
EURUSD Outlook: Weekly Time Frame – Log Scale
Source: Trading view
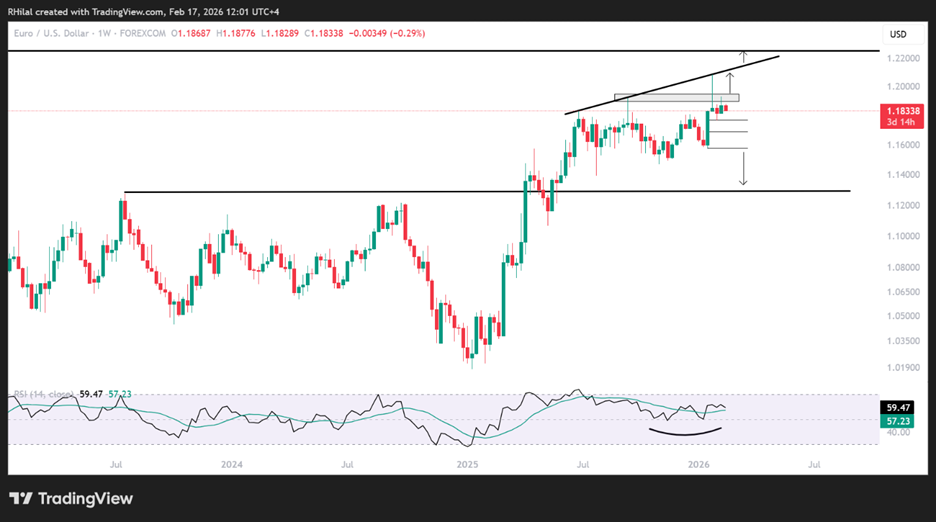
On the weekly chart, EURUSD is facing resistance connecting consecutive higher highs since June 2025, capping gains below the key 1.1950 zone. A daily or weekly close above this level is required to reassert bullish bias toward 1.20, before potentially extending toward the 2022 and 2018 highs near 1.23 and 1.25 respectively.
That outlines the bullish scenario. However, recent price action is turning lower, with downside risks building. A break below 1.1760, which represents the 0.618 retracement of the 2026 advance, could open the door to deeper drawdowns toward:
• 1.1680
• 1.1580
The 1.1580 level becomes pivotal. A hold there could revive bullish momentum. Failure to stabilize may expose the 1.12–1.11 zone, a scenario in which renewed dollar strength takes control.
Gold Outlook: 3 Month Time Frame – Log Scale
Source: Trading view
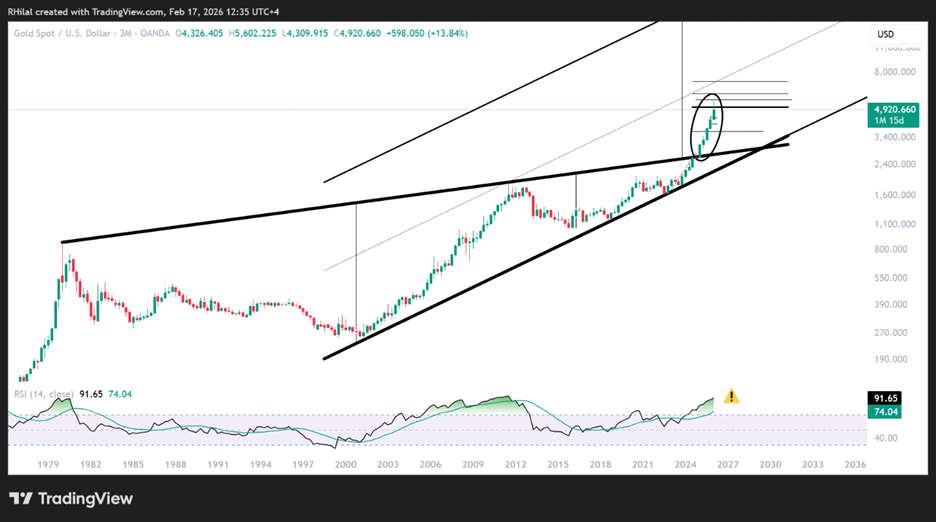
The 3-month time frame is used to place the broader trend into perspective. The uptrend between November 2024 and January 2026 represents a breakout beyond the bounds of a multi-decade consolidation that had been in place since 1980.
This structure was discussed in my previous article Gold, Silver Outlook: Key Levels vs Volatility Risks and video Gold Prices Flash 1980s Signal as CPI Shock Tests Bull Run. The next chart is the weekly chart, where key levels are pointed out for the shorter term.
Gold Outlook: Weekly Time Frame – Log Scale
Source: Trading view
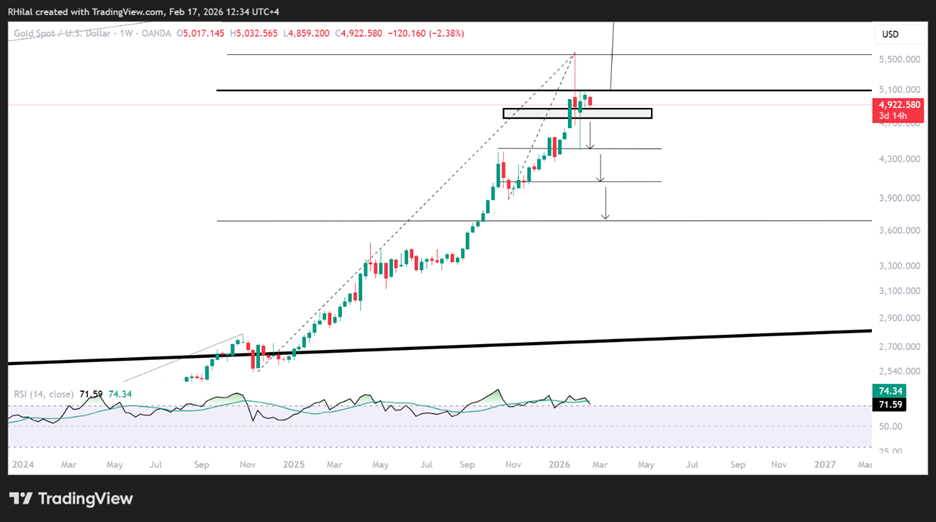
On the weekly chart, the Fibonacci retracement tool is applied to measure the potential drawdown of the move extending from the November 2024 lows to the January 2026 highs. The following levels stand out:
- 4,400 – 0.382 retracement, already respected as a support and dip-buying zone.
- 4,060–4,000 – 0.5 retracement and a major psychological barrier.
- 3,700 – 0.618 retracement, a critical level for potential trend reversal. Failure to hold here could extend losses toward the upper bound of the multi-year consolidation near 3,200, and possibly 2,900.
Written by Razan Hilal, CMT
Follow on X: @Rh_waves
Latest market news




The complete CFD trading experience
Award-winning platforms, competitive spreads, low commissions and dedicated support.
We live and breathe the markets and are dedicated to helping traders realise their ambitions as we continue to set the industry bar.
Economic calendar
Web Trader platform
Our sophisticated web-based platform is packed with features.
Related articles
Canadian Dollar Short-term Outlook: USD/CAD Plunge Stalls at Pivotal Support—Range Break in Focus 11 5 2026
Friday’s U.S. and Canadian employment reports could trigger a decisive USD/CAD move as bulls and bears battle for control at critical support.

GBP/USD Forecast: BoE Caution Leaves the Pound Searching for Direction
Although GBP/USD has gained close to 0.5% over the last three trading sessions, reflecting a period of relative strength for the British pound, today's session has started to show a more neutral tone and the bullish momentum seen earlier in the week has begun to slow.
NFP Preview: New Government, Same Jobs Market?
Traders are still sifting through the fallout of the US midterm elections, just in time to get hit with another volatility: The monthly Non-Farm Payrolls (NFP) report - what will the jobs report show, and what could it mean for the US dollar?

StoneX Europe Ltd may make third party material available on this website which may contain information included but not limited to the conditions of financial markets. The material is for information purposes only and does not contain, and should not be construed as containing, investment advice and/or investment recommendation and/or an investment research and/or an offer of or solicitation for any transactions in financial instruments; any decision to enter into a specific transaction shall be made by the client following an assessment by him/her of their situation.
StoneX Europe Ltd makes no representation or warranty and assumes no liability as to the accuracy or completeness of the information provided, nor any loss arising from any investment based on a recommendation, forecast or other information supplied. You should always seek independent advice as to your suitability to speculate in any related markets and your ability to assume the associated risks, if you are at all unsure. We are not under any obligation to update any such material. Any opinion made may be personal to the author and may not reflect the opinion of StoneX Europe Ltd.