



EURUSD & Nasdaq Face Key Breakout Levels Below 2025 Records
EURUSD and Nasdaq approach key breakout levels as rate-cut expectations, weak U.S. data, and holiday liquidity shape market trends heading into 2026.
Share this:

Key Events
• December rate cut pressures are weighing on the DXY and lifting key assets toward breakout levels approaching their 2025 records
• U.S. PCE, consumer sentiment, and unemployment claims are due this week, alongside a pricing-in rate cut
• FOMC and holiday-period liquidity risks persist across major market trends
As key U.S. economic reports continue to flow in, emphasis is falling on weaker employment data, which is contributing to the pricing in of a December rate cut. This narrative is dominating price action toward key breakout levels near their 2025 extremes. The priced-in Fed rate cut story — combined with an uncertain FOMC tone — is expected to coincide with thin holiday liquidity next week. Should these catalysts align with breakout levels across long-term timeframes, they could define the directional tone heading into 2026, either confirming or reversing the seasonal Santa Claus Rally.
What Is the Santa Rally?
The Santa Rally reflects end-of-year momentum where the final week of December through the first week of January tends to show a positive performance across U.S. indices and precious metals, which have been increasingly positively correlated. Cooling-off risks often appear in mid- to late-Q1 as actual earnings collide with market expectations, potentially bringing markets back to the mean before resuming yearly trends — assuming macro conditions remain stable. However, unpredictable geopolitical, economic, or sector-specific shocks (such as tech-sector pullbacks) can interrupt this seasonal pattern.
Key levels stand to define a potential rally and its impact on currencies heading into 2026
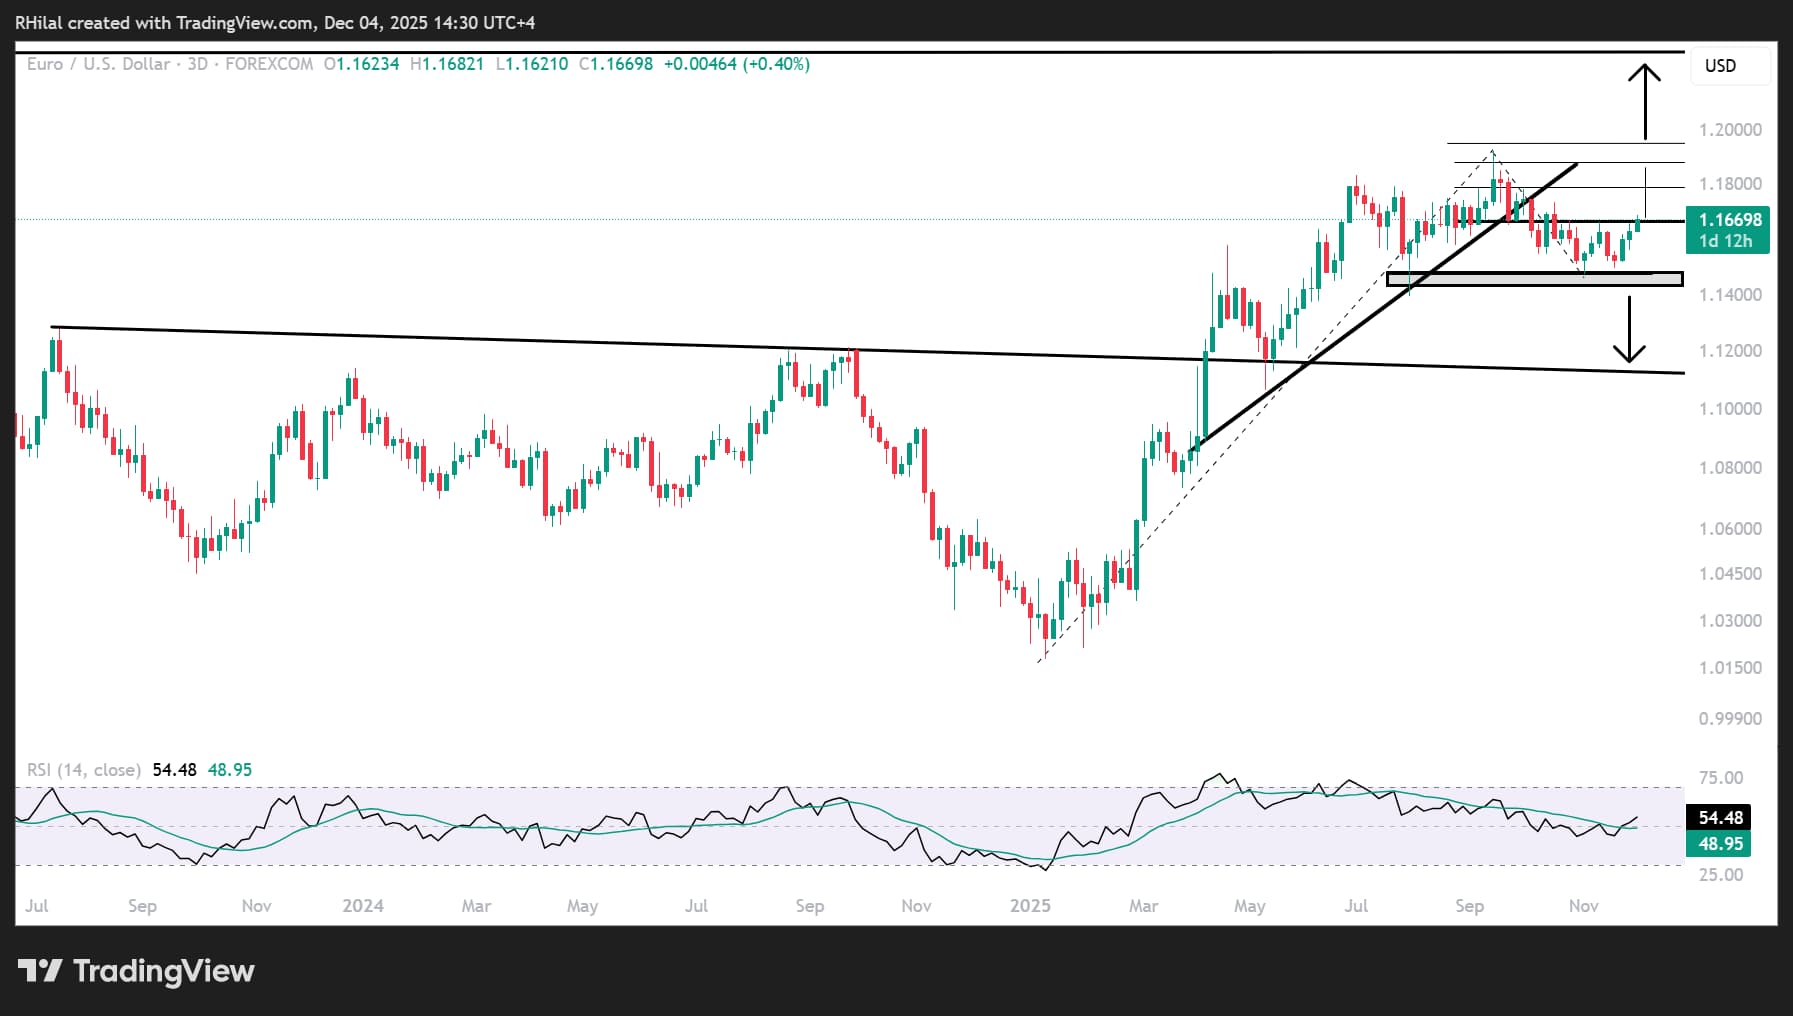
EURUSD Outlook: 3-Day Time Frame – Log Scale
 Source: Trading view
Analyzing the inverse of the DXY chart: DXY Outlook: Pricing in the December Rate Cut
The short-term double-top pattern on the DXY extending across November below the 100.20 mark translates into a potential short-term double-bottom on EURUSD extending above the 1.1480 support, with a key breakout level at 1.1680.
A confirmed hold above 1.1680 is expected to extend gains toward the 1.1870–1.1940 resistance zone, derived from Fibonacci extensions between the 2025 highs, the January–September low, and the November lows, before confirming a breakout above the 1.20 mark.
Downside risks:
The key support level dividing bullish and bearish directional bias is 1.1480. A sustained break below this level may trigger a deeper retracement toward the trendline connecting the July 2023 – September 2024 highs near 1.12. This downside scenario would likely confirm that the consolidation since June 2025 is forming a head-and-shoulders reversal pattern on the EURUSD chart.
Nasdaq Outlook: 3-Day Time Frame – Log Scale
 Source: Trading view
With dovish policy expectations and holiday sentiment in play, U.S. indices remain in a bullish holding pattern below key breakout levels. While the Dow holds near the 48,000 resistance, the Nasdaq trades below the 25,700 resistance — a critical barrier before confirming an extension towards 26,300, and then the 27,000 and 27,700 record targets. These levels are derived from Fibonacci extensions anchored to the April 2025 low, the October high, and the November low.
Downside risks:
A drop back below the 25,200 mark exposes the Nasdaq to declines toward 24,800, 24,400, and 24,100. These zones may revive the uptrend or, if broken, deepen the correction toward 23,300 and 22,700, aligning with Fibonacci retracements of the April–October uptrend, before resuming the primary bullish course in line with expanding tech innovation and technologies.
Written by Razan Hilal, CMT
Follow on X: @Rh_waves
Related tags:


The complete CFD trading experience
Award-winning platforms, competitive spreads, low commissions and dedicated support.
We live and breathe the markets and are dedicated to helping traders realise their ambitions as we continue to set the industry bar.
Economic calendar
Web Trader platform
Our sophisticated web-based platform is packed with features.
Related articles
Nikkei breakout accelerates as yen weakness returns
Nikkei has started October with a powerful breakout, helped by renewed yen weakness and strong upside momentum

AUD/USD hammered by US yields and fading RBA hike bets
US yields, dollar strength and fading RBA hike bets have combined to drive AUD/USD to fresh multi-month lows. The macro and technical bias remains bearish, although history suggests parts of the move are now reaching unusually stretched levels.

EUR/USD Forecast: Euro Struggles to Find Support Even After U.S. PCE Data
The euro continues to face a challenging environment in the short term. The currency has struggled to regain ground against a U.S. dollar that remains firmly supported, a dynamic reflected in EUR/USD, which has now recorded three consecutive losing sessions and a decline of roughly 0.6%.

StoneX Europe Ltd may make third party material available on this website which may contain information included but not limited to the conditions of financial markets. The material is for information purposes only and does not contain, and should not be construed as containing, investment advice and/or investment recommendation and/or an investment research and/or an offer of or solicitation for any transactions in financial instruments; any decision to enter into a specific transaction shall be made by the client following an assessment by him/her of their situation.
StoneX Europe Ltd makes no representation or warranty and assumes no liability as to the accuracy or completeness of the information provided, nor any loss arising from any investment based on a recommendation, forecast or other information supplied. You should always seek independent advice as to your suitability to speculate in any related markets and your ability to assume the associated risks, if you are at all unsure. We are not under any obligation to update any such material. Any opinion made may be personal to the author and may not reflect the opinion of StoneX Europe Ltd.