






EUR/USD Opens 2025 with Fresh Two-Year-Low: 1.0200 Next Big Level Down
EUR/USD is opening 2025 with a fresh two-year-low as sellers extend the bearish trend that started earlier this week. Parity is an obvious point of interest but there’s a big spot of possible support along the way at the 1.0200 handle.
Share this:

EUR/USD Talking Points:
- Sellers have made a push this week, leading to fresh two-year-lows in EUR/USD.
- For next levels below, there’s a Fibonacci level at 1.0200 that’s of interest, as this is the 23.6% retracement of the same setup that caught the high in 2023, before showing support-turned-resistance last year at the 38.2% retracement.
- I’ll be looking at EUR/USD in-depth in the Tuesday webinar, and you’re welcome to sign up: Click here for registration information.
- You’re welcome to access the EUR/USD forecast from the link below:
EUR/USD bears are getting a fast start to 2025 trade, setting a fresh two-year-low for the currency pair. While December produced a higher-low above the November swing for the pair, and 2024 saw EUR/USD close at a trendline projection from that higher-low, sellers have made a push over the past three days and prices are now probing below the 1.0300 level for the first time since November of 2022, when the pair was recovering from its first ever parity test that year.
EUR/USD Daily Price Chart
EUR/USD Next Supports
The parity level is an obvious point of interest for the pair, and this is when one Euro would share the same value as one U.S. Dollar and the pair would print at 1.0000. But there’s only been one instance of such and at the time, the Fed was hiking rates aggressively in 75 bp increments while the ECB had only started to adjust rates higher. And when the pair did plunge below parity, it didn’t hold for long as there was a shift at both the Fed and ECB with the FOMC softening rate hikes and the ECB ramping up to 75 bp moves.
But before parity comes into the picture there’s another level of interest plotted at 1.0200. This is the 23.6% Fibonacci retracement of the 2021-2022 major move and that Fibonacci setup has produced a few different notable inflections. The 61.8% retracement of that study is what caught the high in 2023 trade: and then in 2024 the 38.2% retracement of that same study set support in April and then lower-high resistance in December. There was also interplay at the 50% mark which set the July high before sellers held the November high just six pips inside of that price.
Given the current oversold reading showing on weekly RSI, that 1.0200 level could be a level of interest for bounce plays, or perhaps even reversal scenarios.
EUR/USD Weekly Price Chart
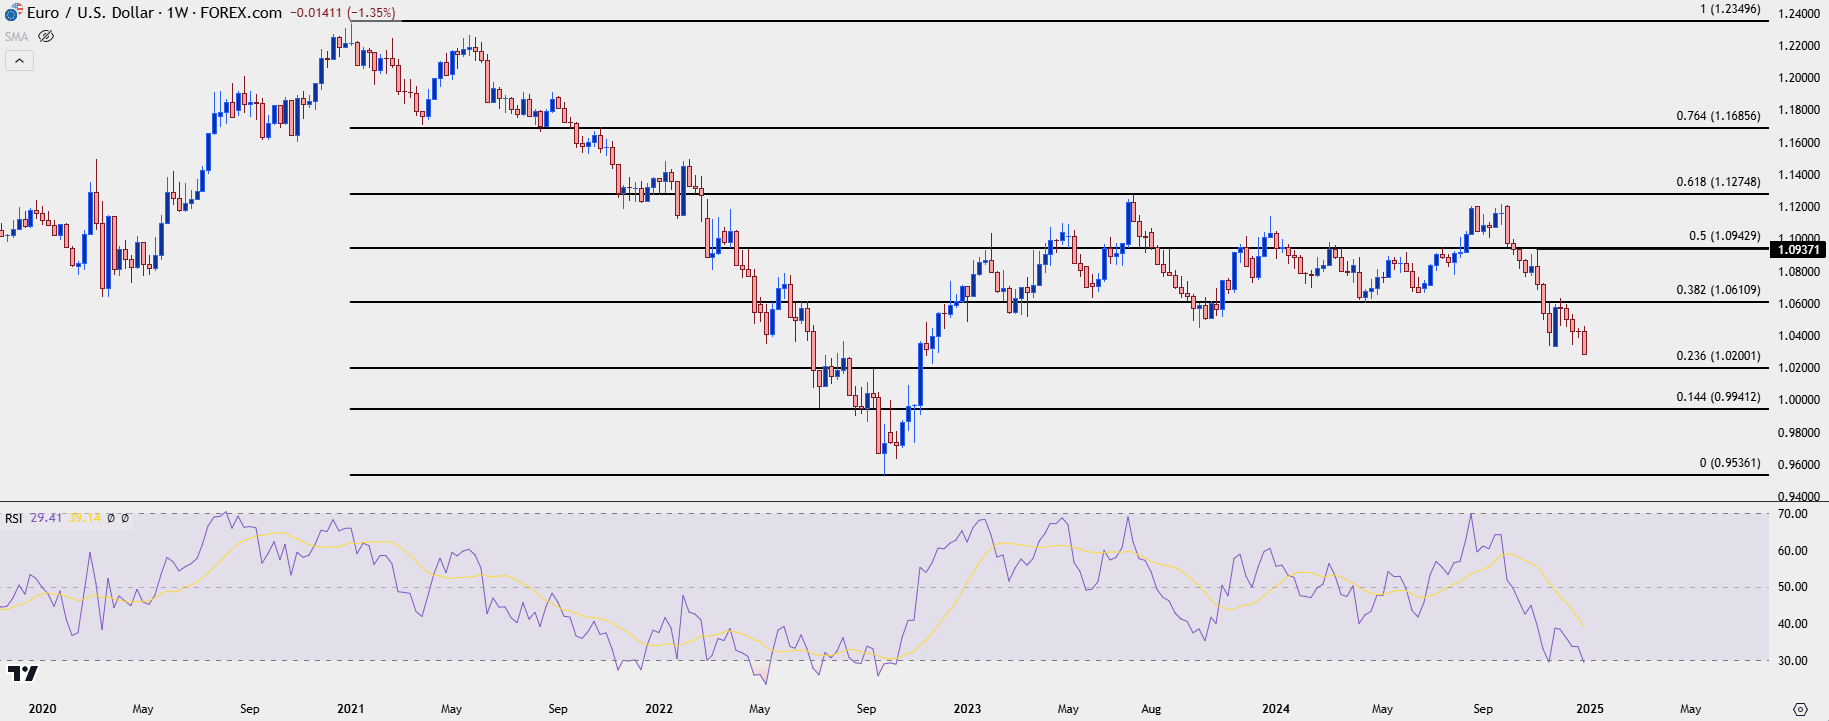 Chart prepared by James Stanley, EUR/USD on Tradingview
--- written by James Stanley, Senior Strategist
EUR/USD Talking Points:
- Sellers have made a push this week, leading to fresh two-year-lows in EUR/USD.
- For next levels below, there’s a Fibonacci level at 1.0200 that’s of interest, as this is the 23.6% retracement of the same setup that caught the high in 2023, before showing support-turned-resistance last year at the 38.2% retracement.
- You’re welcome to access the EUR/USD forecast from the link below:
EUR/USD bears are getting a fast start to 2025 trade, setting a fresh two-year-low for the currency pair. While December produced a higher-low above the November swing for the pair, and 2024 saw EUR/USD close at a trendline projection from that higher-low, sellers have made a push over the past three days and prices are now probing below the 1.0300 level for the first time since November of 2022, when the pair was recovering from its first ever parity test that year.
EUR/USD Daily Price Chart
Chart prepared by James Stanley, EUR/USD on Tradingview
EUR/USD Next Supports
The parity level is an obvious point of interest for the pair, and this is when one Euro would share the same value as one U.S. Dollar and the pair would print at 1.0000. But there’s only been one instance of such and at the time, the Fed was hiking rates aggressively in 75 bp increments while the ECB had only started to adjust rates higher. And when the pair did plunge below parity, it didn’t hold for long as there was a shift at both the Fed and ECB with the FOMC softening rate hikes and the ECB ramping up to 75 bp moves.
But before parity comes into the picture there’s another level of interest plotted at 1.0200. This is the 23.6% Fibonacci retracement of the 2021-2022 major move and that Fibonacci setup has produced a few different notable inflections. The 61.8% retracement of that study is what caught the high in 2023 trade: and then in 2024 the 38.2% retracement of that same study set support in April and then lower-high resistance in December. There was also interplay at the 50% mark which set the July high before sellers held the November high just six pips inside of that price.
Given the current oversold reading showing on weekly RSI, that 1.0200 level could be a level of interest for bounce plays, or perhaps even reversal scenarios.
EUR/USD Weekly Price Chart
--- written by James Stanley, Senior Strategist
Related tags:

The complete CFD trading experience
Award-winning platforms, competitive spreads, low commissions and dedicated support.
We live and breathe the markets and are dedicated to helping traders realise their ambitions as we continue to set the industry bar.
Economic calendar
Web Trader platform
Our sophisticated web-based platform is packed with features.
Related articles

USD/CAD forecast: rally could accelerate above June highs at 1.4250
USD/CAD recovered quickly after weaker US jobs data, keeping the bullish trend in focus. A move above the June highs could accelerate the rally as inflation keeps the Fed under pressure.


USD Sets Fresh Yearly High as EUR/USD Drops Dramatically, USD/JPY Stable
Well, it was a week of USD strength that wasn’t entirely pushed by USD/JPY, as a strong sell-off in EUR/USD has pushed the major pair to its most oversold state in a decade.

Dow Jones Slide Shows What Rate Hike Bets Mean for Stocks
The Dow Jones support breakdown shows rising bond yields and rate hike bets hitting U.S. stocks while tech giants prop up the Nasdaq.
StoneX Europe Ltd may make third party material available on this website which may contain information included but not limited to the conditions of financial markets. The material is for information purposes only and does not contain, and should not be construed as containing, investment advice and/or investment recommendation and/or an investment research and/or an offer of or solicitation for any transactions in financial instruments; any decision to enter into a specific transaction shall be made by the client following an assessment by him/her of their situation.
StoneX Europe Ltd makes no representation or warranty and assumes no liability as to the accuracy or completeness of the information provided, nor any loss arising from any investment based on a recommendation, forecast or other information supplied. You should always seek independent advice as to your suitability to speculate in any related markets and your ability to assume the associated risks, if you are at all unsure. We are not under any obligation to update any such material. Any opinion made may be personal to the author and may not reflect the opinion of StoneX Europe Ltd.