





GBP/USD bulls eye move to 1.27: European open – Nov 27, 2023
GBP/USD has continued to take advantage of a weaker US dollar and rise to an 11-week high. And with a high level of volume activity overhead, we see the potential for a move to 1.27.
Share this:

Asian Indices:
- Australia's ASX 200 index fell by -45.8 points (-0.65%) and currently trades at 6,995.00
- Japan's Nikkei 225 index has fallen by -196.15 points (-0.58%) and currently trades at 33,429.38
- Hong Kong's Hang Seng index has fallen by -174.34 points (-0.99%) and currently trades at 17,385.08
- China's A50 Index has fallen by -176.55 points (-1.48%) and currently trades at 11,713.22
UK and European indices:
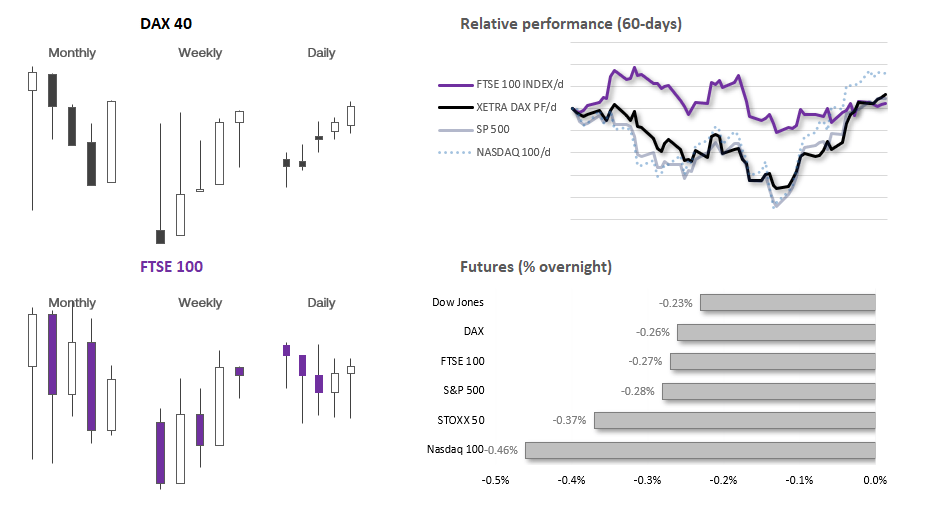
- UK's FTSE 100 futures are currently down -21 points (-0.28%), the cash market is currently estimated to open at 7,467.20
- Euro STOXX 50 futures are currently down -15 points (-0.34%), the cash market is currently estimated to open at 4,357.10
- Germany's DAX futures are currently down -41 points (-0.26%), the cash market is currently estimated to open at 15,988.49
US index futures:
- DJI futures are currently down -82 points (-0.23%)
- S&P 500 futures are currently down -13 points (-0.28%)
- Nasdaq 100 futures are currently down -72.75 points (-0.45%)
US bond yields gapped higher at the week’s open, to extend Friday’s gains. It was enough to knock sentiment at the start of the week and weigh on US index futures markets, and add to pressures for Chinese equity markets which were already under pressure following weak data from. Industrial profits fell -7.8% YTD in October.
We’re heading into the final few days of the month, which currently sees the US dollar as the weakest forex major with NZD/USD, AUD/USD and GBP/USD leading the way. For these classic risk-on tones to persist, we’d likely need to see a combination of slightly softer US data alongside another week of increased bond demand at this week’s auctions. Softer data plays nicely into the ‘Fed’s peak rate and 2024 cuts’ theme without fanning fears of an outright recession, which could actually see the dollar suck in safe haven flows and weigh on risk appetite. And if bond yields continue to move lower while investors step into the bond market, it could allow Wall Street to at least hold on to recent gains - if not extend them.
We don’t have any high-impact news scheduled for today, and with US traders returning to their desks with month-end flows in sight, we may find price action on the fickle side. Therefore we’d prefer to keep trading opportunities to intraday timeframes and seek smaller moves, or wait for longer-term swig trades to setup on the daily timeframe or above.
Events in focus (GMT):
- 11:00 – UK distributed traders survey (CBI)
- 13:00 – US building permits
- 13:10 – German Buba Balz speaks
- 14:00 – ECB’s Christine Lagarde speaks
- 15:00 – US home sales
- 15:30 – US Dallas Fed manufacturing business index
- 16:30 – US bond auctions (3-month, 6-month, 2-year, 10-year)
- 20:30 – COT report (Commitment of traders)
GBP/USD technical analysis (daily chart):
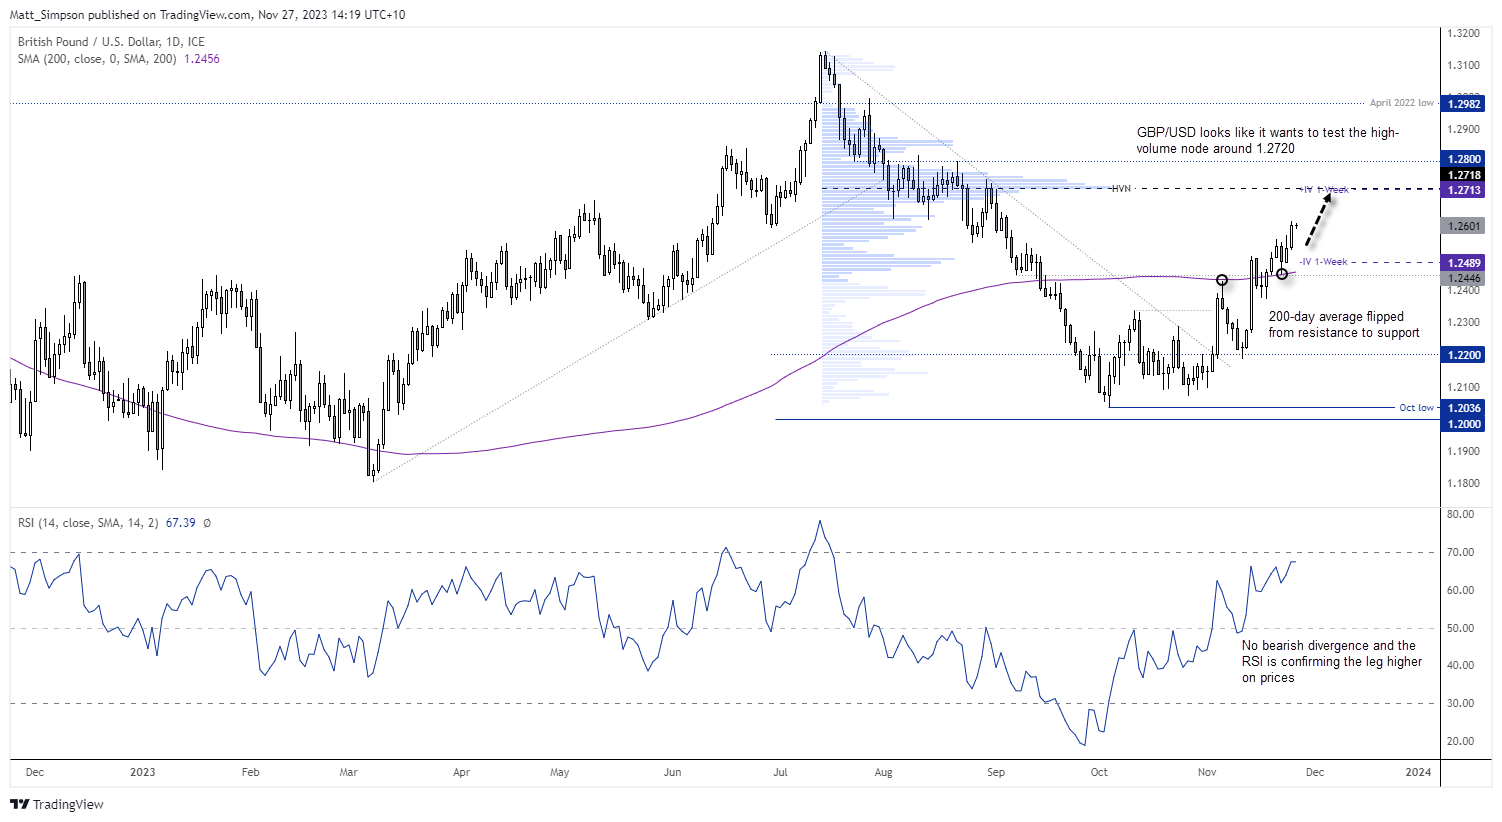
The British pound has continued to take advantage of the weaker US dollar, and rose to an 11-week high around 1.26. Support was found around the 200-day average on Wednesday ahead of its most recent leg higher, and as of yet there is no immediate sigs of a top forming. A slight bearish divergence is forming on RSI (2), yet RSI (14) continues to confirm the rise of prices with no bearish divergence, and it is yet to reach overbought (above 80).
With a strong bullish trend structure, I’m now looking for GBP/USD to extend its gains towards 1.2720 near the HVN (high volume node) from the bear move from the July high to October low. Incidentally, the upper 1-week implied volatility level lands right on the HVN, adding to its potential as a bullish target.
GBP/USD technical analysis (1-hour chart):
The 1-hour chart displays a nice bullish trend for GBP/USD, where volumes are rising as prices advance and diminish during period of consolidation or retracements. Prices are forming a potential bull flag whilst holding above the 10-hour EMA, and the RSI (14) is also confirming price action on this timeframe with no signs of a bearish divergence. The monthly R3 pivot is currently capping as resistance, but a break above last week’s high invalidates the level and assumes bullish continuation.
Should prices initially retrace lower, bulls could seek evidence of a swing low to anticipate its next leg higher.
View the full economic calendar
View the full economic calendar
-- Written by Matt Simpson
Follow Matt on Twitter @cLeverEdge
How to trade with City Index
You can trade with City Index by following these four easy steps:
- Open an account, or log in if you’re already a customer
• Open an account in the UK
• Open an account in Australia
• Open an account in Singapore
- Search for the market you want to trade in our award-winning platform
- Choose your position and size, and your stop and limit levels
- Place the trade
Related tags:


The complete CFD trading experience
Award-winning platforms, competitive spreads, low commissions and dedicated support.
We live and breathe the markets and are dedicated to helping traders realise their ambitions as we continue to set the industry bar.
Economic calendar
Web Trader platform
Our sophisticated web-based platform is packed with features.
Related articles
USD/JPY weekly outlook: Quarter turn scrambles rates regime
USD/JPY’s tight relationship with front-end US rates broke down sharply last week, but quarter-turn flows and positioning suggest the disconnect may prove temporary.

USD/CAD forecast: rally could accelerate above June highs at 1.4250
USD/CAD recovered quickly after weaker US jobs data, keeping the bullish trend in focus. A move above the June highs could accelerate the rally as inflation keeps the Fed under pressure.


USD Sets Fresh Yearly High as EUR/USD Drops Dramatically, USD/JPY Stable
Well, it was a week of USD strength that wasn’t entirely pushed by USD/JPY, as a strong sell-off in EUR/USD has pushed the major pair to its most oversold state in a decade.

StoneX Europe Ltd may make third party material available on this website which may contain information included but not limited to the conditions of financial markets. The material is for information purposes only and does not contain, and should not be construed as containing, investment advice and/or investment recommendation and/or an investment research and/or an offer of or solicitation for any transactions in financial instruments; any decision to enter into a specific transaction shall be made by the client following an assessment by him/her of their situation.
StoneX Europe Ltd makes no representation or warranty and assumes no liability as to the accuracy or completeness of the information provided, nor any loss arising from any investment based on a recommendation, forecast or other information supplied. You should always seek independent advice as to your suitability to speculate in any related markets and your ability to assume the associated risks, if you are at all unsure. We are not under any obligation to update any such material. Any opinion made may be personal to the author and may not reflect the opinion of StoneX Europe Ltd.