



Gold bulls beware if the dollar starts to turn
Gold has surged to fresh multi-month highs, but tentative signs the US dollar may be trying to bottom provide an early warning for bulls.
Share this:

- Gold tracks silver, copper as dollar weakens
- DXY flashes tentative bottoming signals near 98.75
- Gold trend stays bullish, dollar rebound the risk
Gold has been a major beneficiary of the latest dollar-debasement narrative, hitting fresh multi-month highs in Asian trade on Monday. But tentative signs the US dollar may be trying to bottom ahead of an expected fiscal update from Treasury Secretary Scott Bessent provide a warning for bullion bulls that near-term reversal risks may be growing.
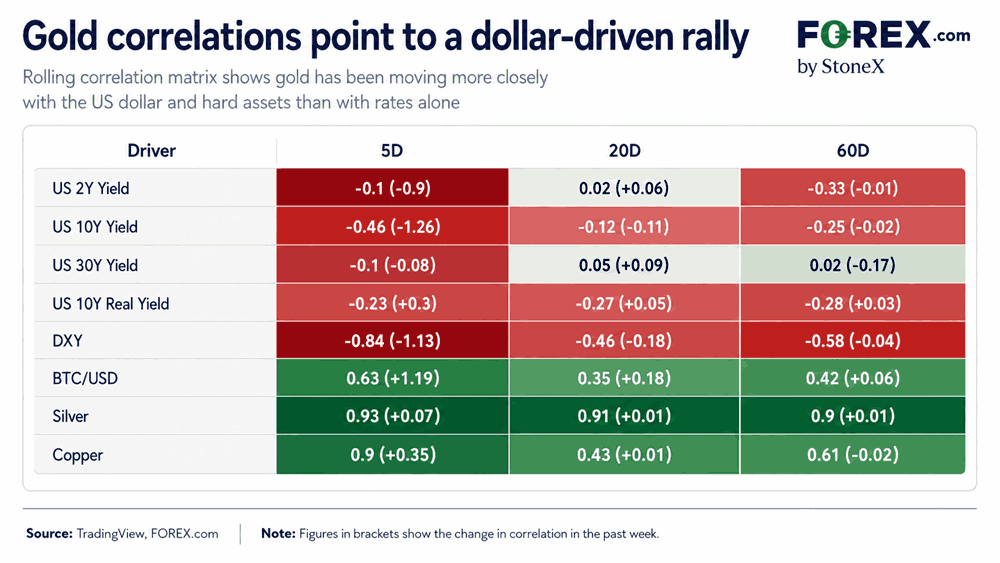
Gold trades with silver, copper and crypto
Source: TradingView, FOREX.com
This content was created by an affiliate of FOREX.com and represents the views and opinions of the author/speakers, not the views and opinions of FOREX.com, StoneX Group Inc., or its subsidiaries. The content has not been independently reviewed by FOREX.com.
The correlation matrix above reinforces the message. Over the past five days, gold has moved almost in lockstep with silver and copper, with correlations of +0.93 and +0.90 respectively, while its positive relationship with Bitcoin has also strengthened noticeably to +0.63.
At the same time, gold’s inverse correlation with the US dollar index has fallen to -0.84, considerably stronger than its relationship with either nominal or real Treasury yields across the curve. While caution should always be applied given the short time frame, it hints that broad dollar weakness, rather than fluctuations in the curve alone, has been an important driver of gold’s latest leg higher.
This content was created by an affiliate of FOREX.com and represents the views and opinions of the author/speakers, not the views and opinions of FOREX.com, StoneX Group Inc., or its subsidiaries. The content has not been independently reviewed by FOREX.com.
DXY attempting to carve out a bottom?
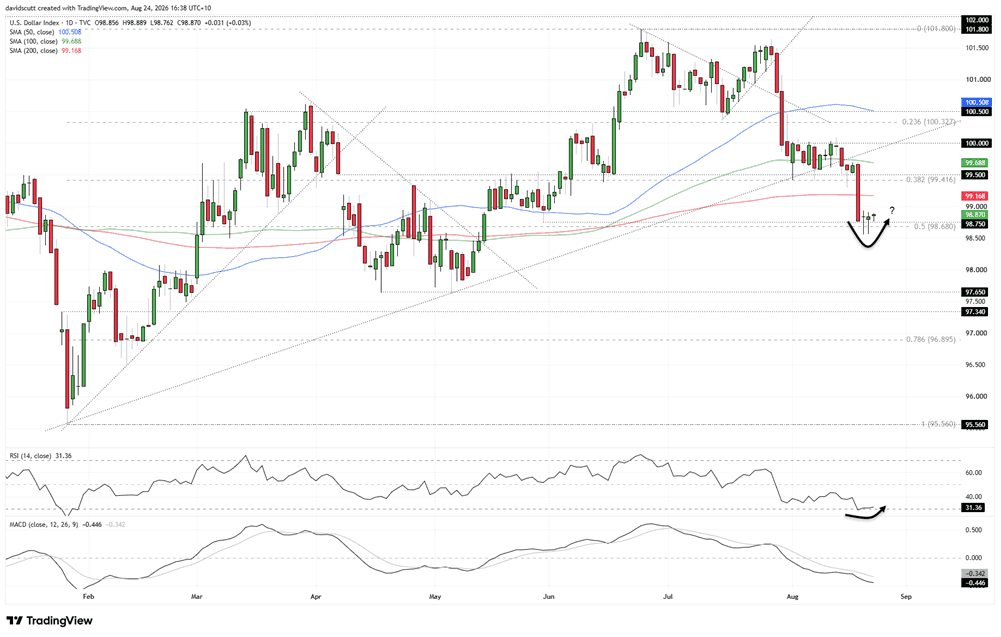
While correlations do not always imply causation and relationships can change abruptly, if the recent inverse relationship between DXY and gold persists, the dollar chart provides some food for thought for gold bulls.
Source: TradingView
DXY looks like it is attempting to bottom, with bids emerging below 98.75 around the 50% retracement of the January to June bull move. A dragonfly doji followed by a hammer after a pronounced bearish move warns of the potential for a squeeze higher ahead of Bessent’s announcement. There are also tentative signs that bearish momentum may have reached its crescendo with RSI (14) crawling back out of oversold territory.
Gold trend remains firmly bullish
Source: TradingView
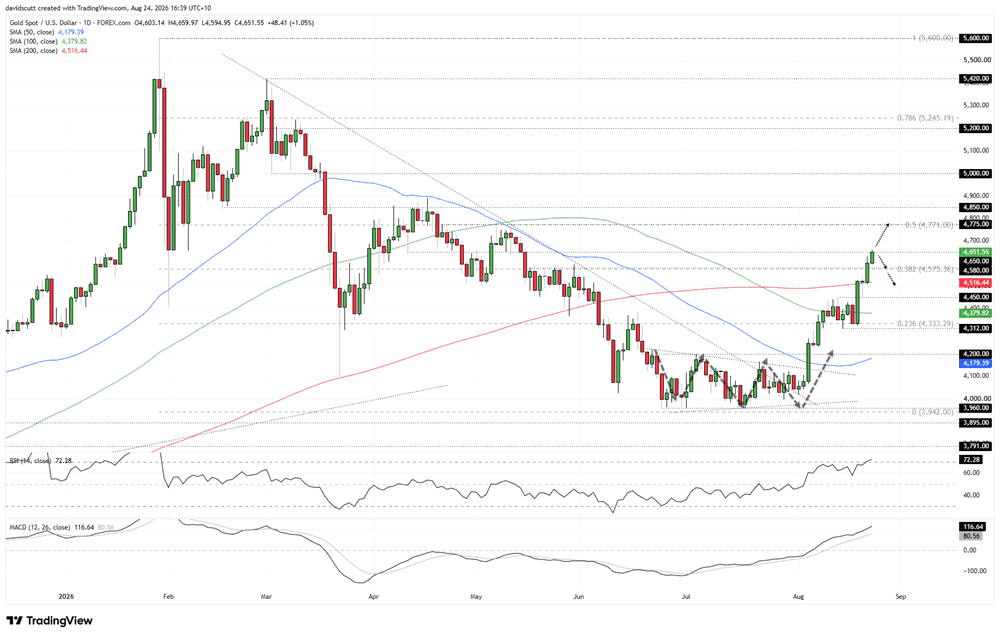
While dollar headwinds may be building, the technical picture for gold remains uniformly bullish. The price broke above its longer-term downtrend in July before staging a dramatic breakout of the wedge structure it had been coiling within for several months. Since then, the price has reclaimed the 50, 100 and 200-day moving averages while continuing to print higher highs and higher lows.
The latest leg higher has taken gold to around $4,650 an ounce, a level that repeatedly acted as both support and resistance earlier this year. That makes it the immediate focal point, particularly given the tentative signs of stabilisation in DXY. Gold has already poked above the level several times during Asian trade without managing to extend the move, making price action into the European session potentially important as volumes pick up.
Above $4,650, the first level to watch is $4,771, the 50% retracement of the January to June bear move. Beyond that sits $4,850, another level that has acted as both support and resistance this year, before the psychologically important $5,000 level comes into view.
On the downside, the first area of interest sits around $4,575-$4,580, where the 38.2% retracement of the January to June bear move converges with former resistance. Below that, the 200-day moving average and $4,450 are the next levels to watch, with the latter marking last week’s breakout zone that was subsequently retested from above.
The oscillators continue to deliver a bullish message. RSI(14) is trending higher and now sits marginally in overbought territory around 72, while MACD has staged a bullish crossover and is now diverging from the signal line in positive territory.
Overall, the setup still favours buying dips. However, the strong inverse relationship with DXY, combined with tentative signs the dollar may be trying to bottom, warns that the risk of a near-term reversal in gold is starting to build.
Latest market news




The complete CFD trading experience
Award-winning platforms, competitive spreads, low commissions and dedicated support.
We live and breathe the markets and are dedicated to helping traders realise their ambitions as we continue to set the industry bar.
Economic calendar
Web Trader platform
Our sophisticated web-based platform is packed with features.
Related articles
Swiss Franc Short-term Outlook: USD/CHF Selloff Nears Critical Support Ahead of NFP 11 4 2026
USD/CHF bears are closing in on critical trend support, with the next reaction likely to determine whether the October decline has further to run.

US Midterm Fallout: What Does the “Blue Tsunami” Mean for the S&P 500?
Democrats made sweeping gains in the US midterm elections, winning control of both the House and Senate - what does it mean for the S&P 500 and the AI trade?

Euro Technical Outlook: EUR/USD Support Reversal Sets Up Breakout Test Ahead of NFP 11 4 2026
Euro bulls are attempting to build on the rebound from recent lows, but pivotal resistance still stands in the way of a larger EUR/USD recovery.
StoneX Europe Ltd may make third party material available on this website which may contain information included but not limited to the conditions of financial markets. The material is for information purposes only and does not contain, and should not be construed as containing, investment advice and/or investment recommendation and/or an investment research and/or an offer of or solicitation for any transactions in financial instruments; any decision to enter into a specific transaction shall be made by the client following an assessment by him/her of their situation.
StoneX Europe Ltd makes no representation or warranty and assumes no liability as to the accuracy or completeness of the information provided, nor any loss arising from any investment based on a recommendation, forecast or other information supplied. You should always seek independent advice as to your suitability to speculate in any related markets and your ability to assume the associated risks, if you are at all unsure. We are not under any obligation to update any such material. Any opinion made may be personal to the author and may not reflect the opinion of StoneX Europe Ltd.