



Gold Falters at Resistance, Grappling With PCE, Month-End Flows and Jackson Hole
Gold has pulled back from resistance after sticky PCE data, with month-end flows and Jackson Hole now shaping the near-term outlook.
Share this:

Gold has enjoyed a strong month, but momentum has started to falter after the rally stalled near resistance. Sticky US inflation and firm growth data supported the US dollar, while month-end flows and Kevin Warsh’s Jackson Hole speech add further near-term risk. Dip buyers may still be lurking below, but gold could face a deeper retracement before bulls attempt another push higher.
View related analysis:
- AUD/USD Shorts Bear the Brunt of Hot CPI, Renewed RBA Hike Bets
- Nasdaq 100 Braces for Nvidia Earnings, Jackson Hole and Volatility
- Jackson Hole FX Returns: Volatility Analysis for USD Dollar, FX Majors
- FX Futures Positioning: USD Falls, CAD Strengthens, JPY Shorts Return | COT Report
- How to Read the COT Report to Track Forex Market Sentiment
View related analysis:
- AUD/USD Shorts Bear the Brunt of Hot CPI, Renewed RBA Hike Bets
- Nasdaq 100 Braces for Nvidia Earnings, Jackson Hole and Volatility
- Jackson Hole FX Returns: Volatility Analysis for USD Dollar, FX Majors
- FX Futures Positioning: USD Falls, CAD Strengthens, JPY Shorts Return | COT Report
- How to Read the COT Report to Track Forex Market Sentiment
Gold Falters Near Resistance After Sticky PCE
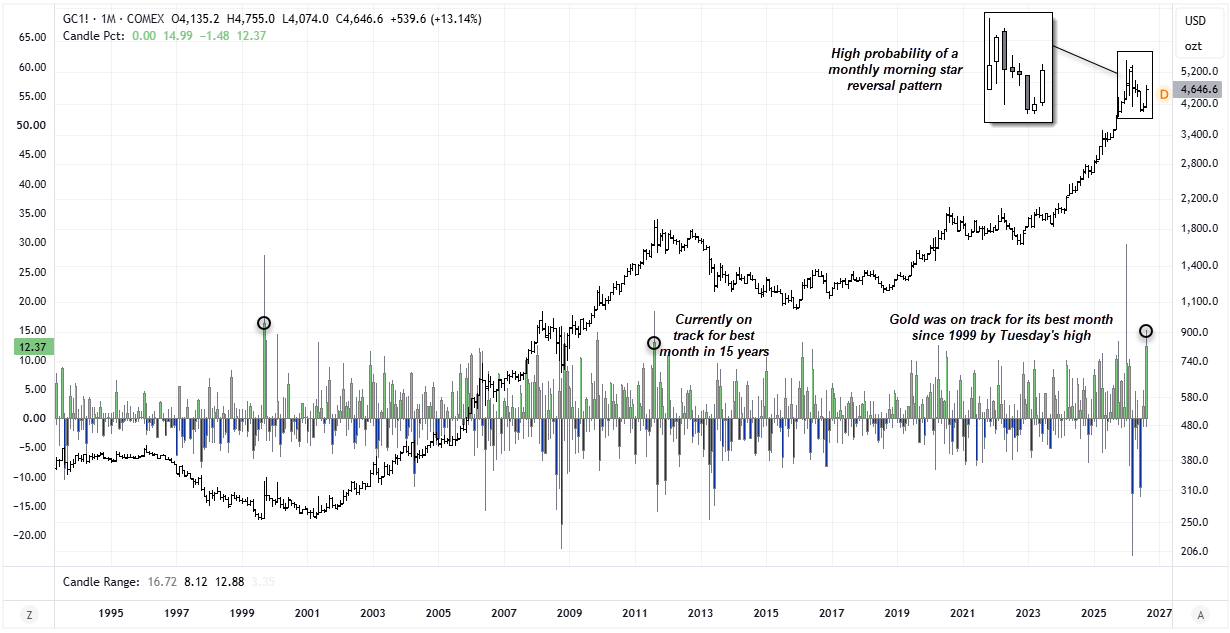
It has been a solid month for gold, which at Tuesday’s high was briefly on track for its best monthly performance since September 1999. But with the rally stalling around resistance and printing a small doji ahead of PCE inflation and Jackson Hole, a wobble or two into month-end was perhaps inevitable. That is what we saw on Wednesday following the sticky PCE inflation report.
Source: COMEX, TradingView
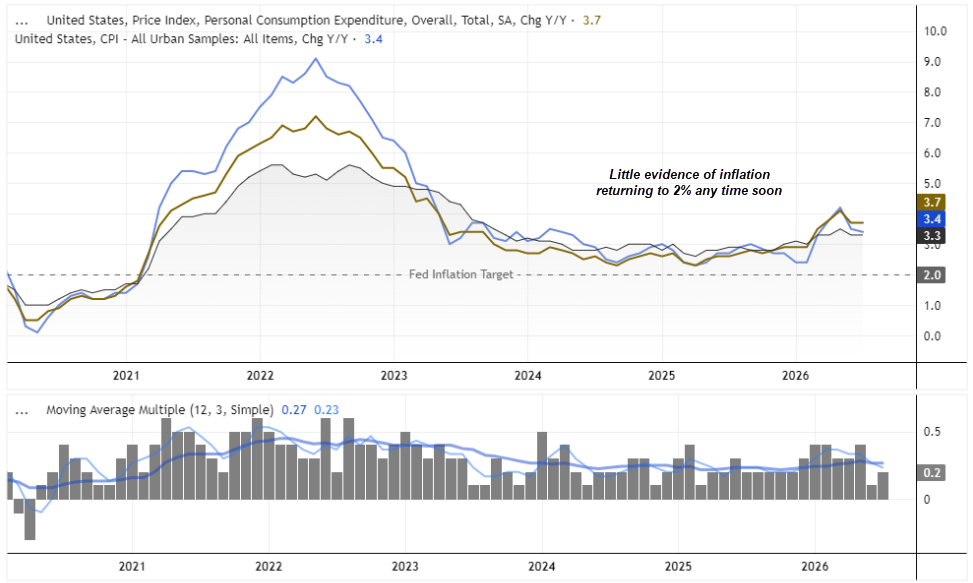
While PCE data landed mostly as expected, it did not deliver the softening some had hoped for, with core PCE at 3.3% y/y and still well above the Fed’s 2% target. The final estimate for Q2 GDP was revised higher to 3.6%, real consumer spending rose to 3.4% and company profits increased 8.2%.
These are hardly recessionary signals and provide little reason to expect any hint of dovishness from Kevin Warsh at his Jackson Hole speech on Friday. The US dollar was therefore the strongest FX major on Wednesday, to the detriment of gold, which leaves scope for a deeper near-term retracement.
Source: BEA, LSEG
Gold Dip Buyers May Still Lurk Below
Further out, I still suspect gold will benefit from a dip-buying mentality, particularly from traders frustrated at missing the first leg higher. Unless the gold market suffers a much deeper reversal, retracements may continue to be viewed as opportunities to re-enter in anticipation of an eventual break above 5,000.
Futures and Options Sentiment Remains Bullish
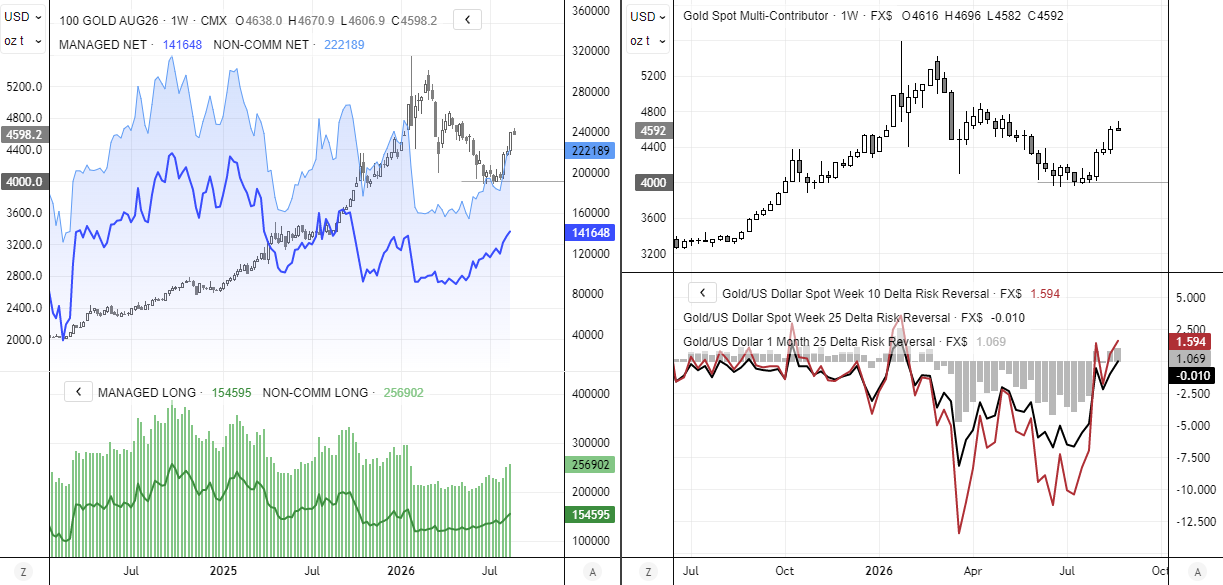
Sentiment across futures and options currently backs up that assumption. Net-long exposure continues to trend higher among large speculators and managed funds, while total open interest is rising alongside gold prices to suggest strong demand from futures participants.
The one-week 10-delta risk reversal is also positive, suggesting tail risk is skewed to the upside. Risk reversals more broadly point to greater demand for calls than puts among institutional participants.
That said, I am not yet convinced gold will simply push straight to a fresh high unless the wheels truly fall off the US dollar. We do not yet have the backdrop for that kind of USD selloff. Although I have outlined my longer-term bearish bias on the dollar using the multi-year charts, those themes can take months to play out.
If US data remains supportive of the dollar and keeps the Fed hawkish, a complete USD collapse still looks unlikely for now. In theory, that could stifle a break to new highs for gold over the near term.
Source: COMEX, CFTC (COT), LSEG


Gold Futures (GC) Technical Analysis
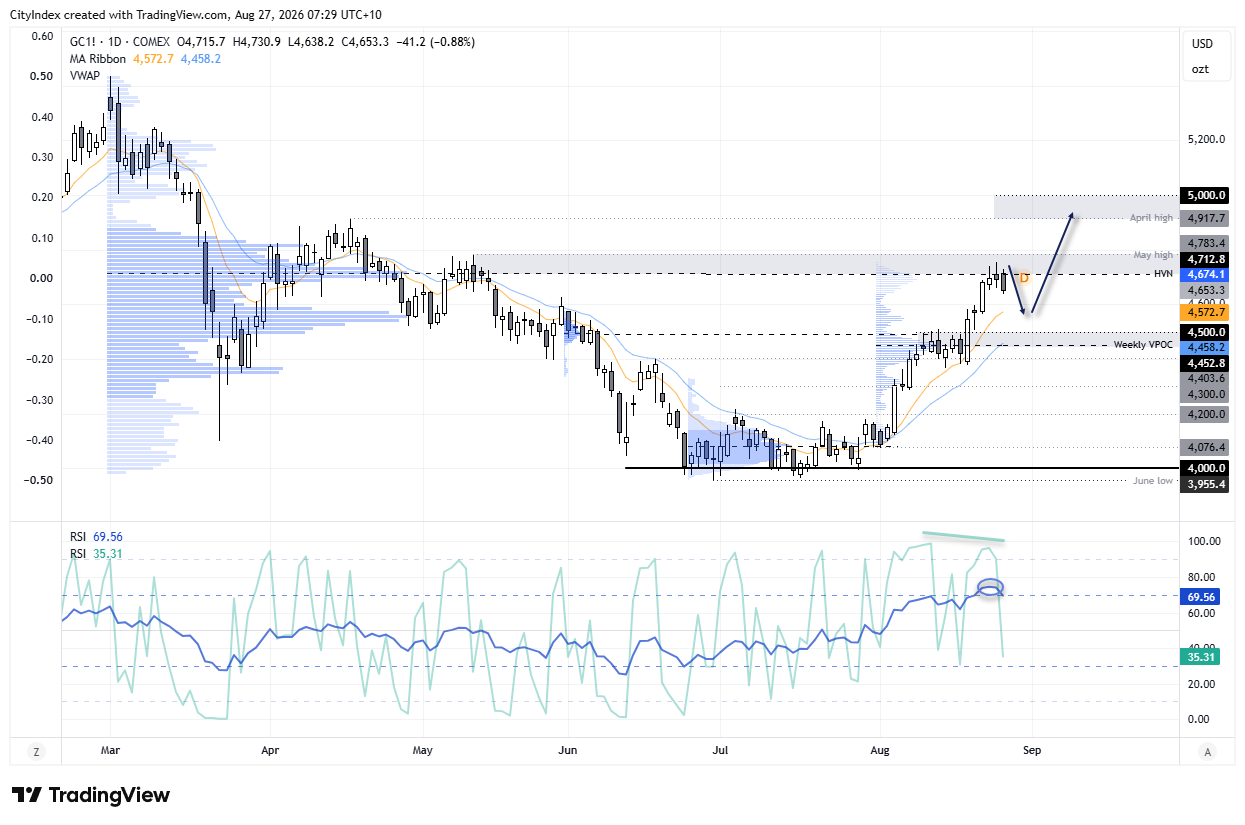
The daily chart shows the rally stalling around the 4,700 handle and 4,712.8 high-volume node (HVN), just beneath the May high. A small bearish engulfing candle also formed on Wednesday, leaving gold vulnerable to a pullback should Warsh lean too hawkish on Friday. Also note that the RSI (14) reached overbought territory on Tuesday, while a bearish divergence formed on the RSI (2) within its overbought zone.
While at least a minor pullback seems feasible, I am not convinced it will be particularly deep either. A move back towards 4,500 could be viewed as a gift by bulls.
But with another full day and a half before Warsh speaks, bulls may still put up a fight. Bears may look to fade moves towards the May high in anticipation of a pullback towards the 10- or 20-day EMAs, with the 4,500 handle and weekly VPOC at 4,458 potentially providing support if those averages break.
A move above the May high would bring the 4,918 April high and 5,000 handle into focus.
Source: ICE, TradingView
View the full economic calendar
View the full economic calendar
-- Written by Matt Simpson
Follow Matt on Twitter @cLeverEdge
How to trade with City Index
You can trade with City Index by following these four easy steps:
- Open an account, or log in if you’re already a customer
• Open an account in the UK
• Open an account in Australia
• Open an account in Singapore
- Search for the market you want to trade in our award-winning platform
- Choose your position and size, and your stop and limit levels
- Place the trade
Related tags:
Latest market news




The complete CFD trading experience
Award-winning platforms, competitive spreads, low commissions and dedicated support.
We live and breathe the markets and are dedicated to helping traders realise their ambitions as we continue to set the industry bar.
Economic calendar
Web Trader platform
Our sophisticated web-based platform is packed with features.
Related articles
Silver's bullish breakout case builds as bond yields retreat
The Democratic blue wave has sent crude and Treasury yields sharply lower, improving the outlook for precious metals. With gold already breaking higher, could silver be next?
Swiss Franc Short-term Outlook: USD/CHF Selloff Nears Critical Support Ahead of NFP 11 4 2026
USD/CHF bears are closing in on critical trend support, with the next reaction likely to determine whether the October decline has further to run.


Euro Technical Outlook: EUR/USD Support Reversal Sets Up Breakout Test Ahead of NFP 11 4 2026
Euro bulls are attempting to build on the rebound from recent lows, but pivotal resistance still stands in the way of a larger EUR/USD recovery.
StoneX Europe Ltd may make third party material available on this website which may contain information included but not limited to the conditions of financial markets. The material is for information purposes only and does not contain, and should not be construed as containing, investment advice and/or investment recommendation and/or an investment research and/or an offer of or solicitation for any transactions in financial instruments; any decision to enter into a specific transaction shall be made by the client following an assessment by him/her of their situation.
StoneX Europe Ltd makes no representation or warranty and assumes no liability as to the accuracy or completeness of the information provided, nor any loss arising from any investment based on a recommendation, forecast or other information supplied. You should always seek independent advice as to your suitability to speculate in any related markets and your ability to assume the associated risks, if you are at all unsure. We are not under any obligation to update any such material. Any opinion made may be personal to the author and may not reflect the opinion of StoneX Europe Ltd.