




Gold, Wall Street slammed as PMI data stifles hopes of Fed rate cuts
The record highs created for gold and Wall Street this week appear to have been bad omens, with sharp bearish reversals forming and rate-cut bets being slashed.
Share this:

The Fed-rate obsession continues to drive market sentiment. Traders were quick to price in Fed cuts again upon the arrival of slightly softer CPI figures and NFP report, forcing Fed members to push back on rate cuts this week. Yet, with dove-tinted glasses on, traders had become fixated on any scraps of softer data to justify their hopes of Fed cuts. That is, until Thursday's strong PMI figures were released.
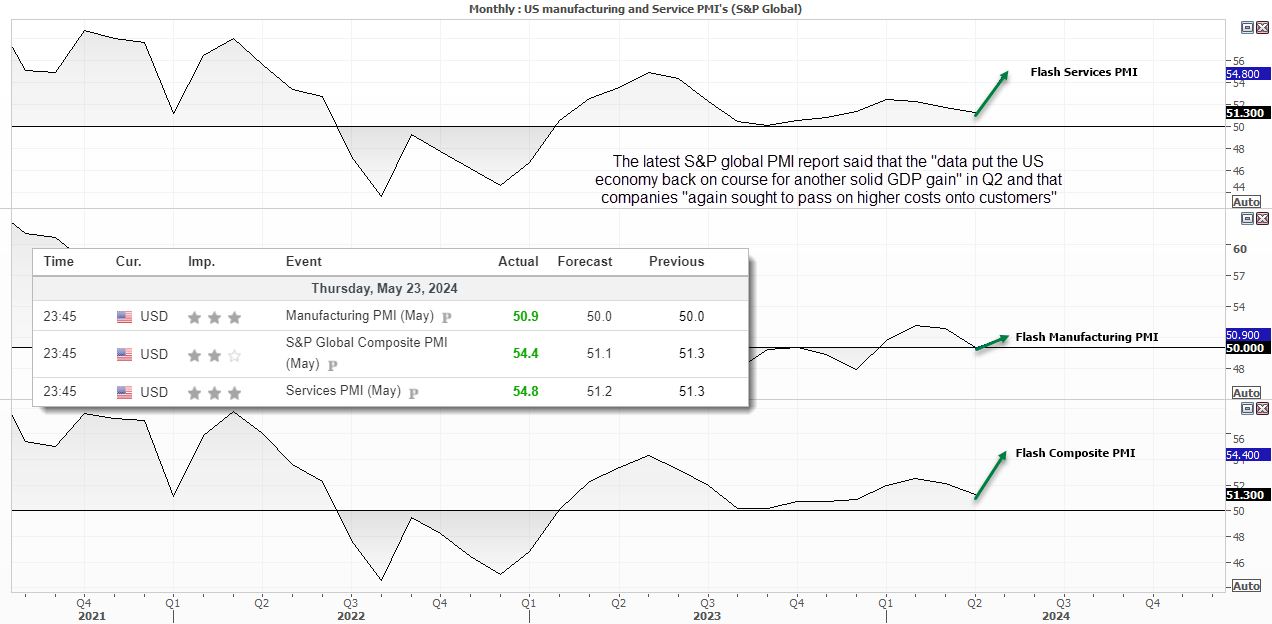
S&P services PMIs accelerated higher in May
- Service PMI expanded at its fastest pace in over two years at 54.8 (51.3 prior)
- It was the 16th month of expansion for the sector
- The 3.1 point rise in services was the fastest n/n gain in 15 months
- Services business activity rose to a 12-month high
- “The data put the US economy back on course for another solid GDP gain” in Q2, according to the report
- “Manufacturer’s input prices rose sharply in May”
- “Companies again sought to pass higher costs onto customers in the form of higher selling prices”
Expansive growth is usually a good thing. But not for traders who are positioned for Fed cuts. And with PMIs pointing to firmer growth and potentially another round of inflation, hopes of beloved cuts have quickly evaporated, and—dare we say—concerns of another hike may be brewing. And that was bad for market sentiment, including gold.
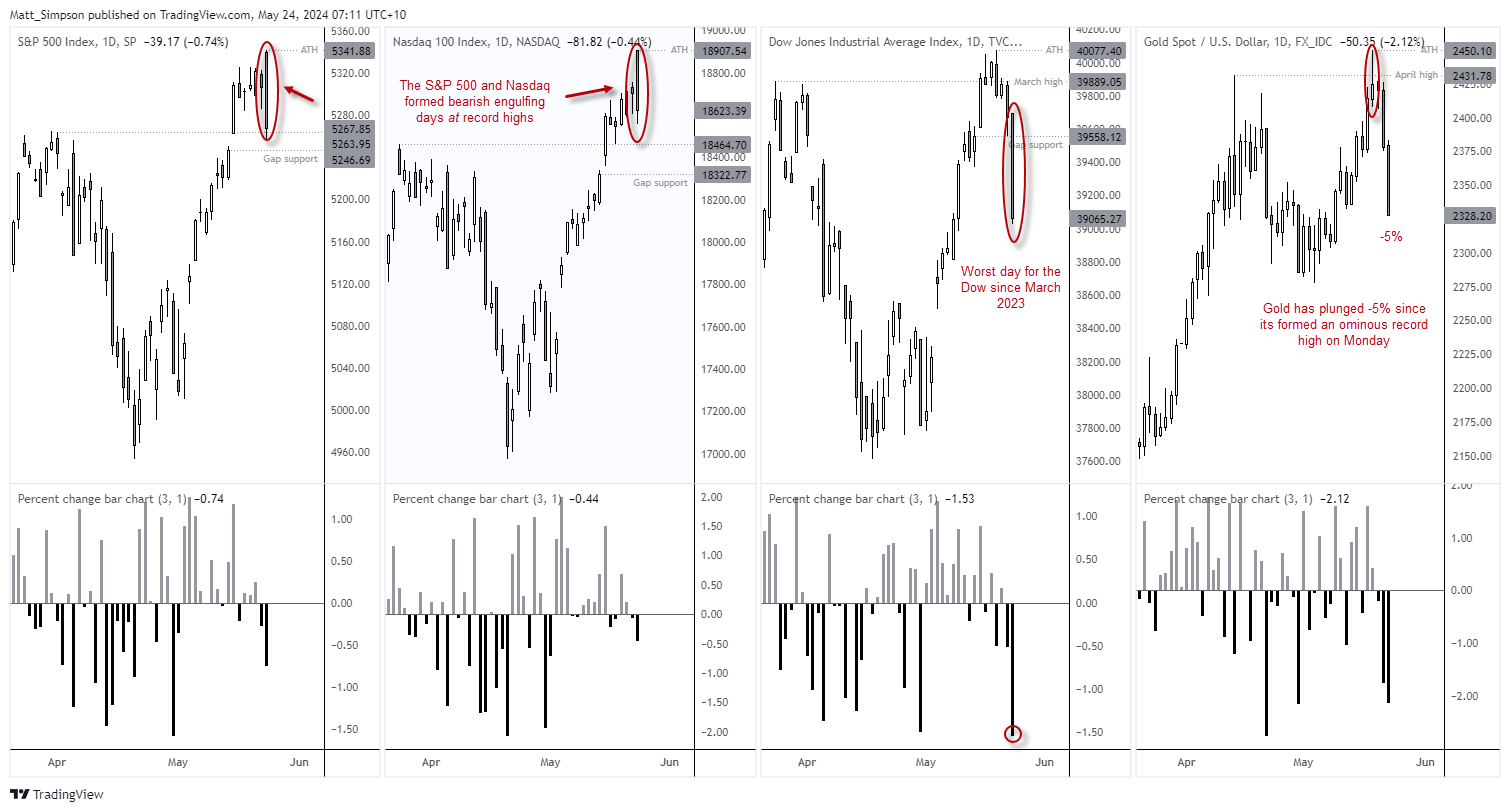
Gold and Wall Street indices fall in tandem on crushed hopes of Fed cuts cuts
- It was the worst day in a month for gold, falling over 2% on Thursday and now -5% lower from its record high set on Monday
- The Dow Jones suffered its worst day in 14 months at -1.5%, and is now -2.6% off its record high set on Monday
- Prominent bearish engulfing candles formed on the S&P 500 and Nasdaq 100 indices, both of which sustained their worst day’s performance in over three weeks
- Key reversals at record highs can be indicative of a larger selloff, and that could also weigh on gold if traders need to cover their precious metal holdings to nurse stock-market losses
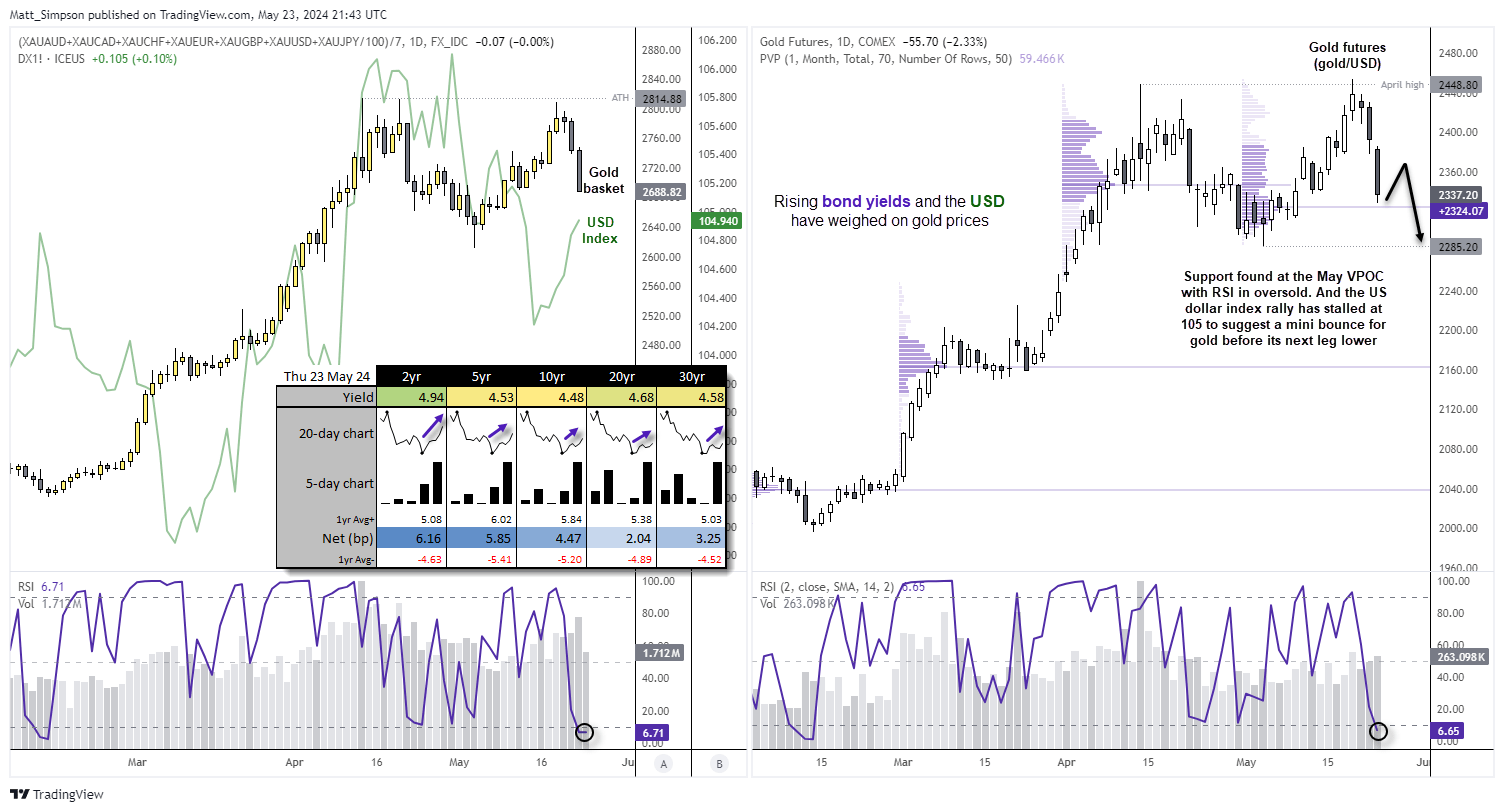
The gold basket provided clues of a potential false break
There were quite a few gold headlines generated on Monday when it broke to a record high during Asian trade. Yet I warned not to chase the move, given my equally weighted gold basket (against FX majors) remained beneath its own record high set in April, as it suggested the break higher on gold future was due to US dollar weakness and not gold strength. And that turned out to be an excellent filter for not seeking longs around those highs.
Rising US yields and the stronger US dollar have sent the gold basket and gold prices to a two-week low. The repricing of Fed cut expectations has certainly shaken some gold bulls out of those highs and prompted bears to step in to drive prices sharply lower. The US 2-year yield is just 0.6 percentage points below 5%, and the US dollar index reached my 105 target on Thursday. Given I expect yields and the US dollar to continue higher from here, it suggests further downside for gold.
With that said, the daily RSI (2) has reached oversold for the gold basket and gold futures prices. Yesterday's low also found support above the current month's VPOC (volume point of control), which can act as a level of support. And given the US dollar index rally stalled at 105, I suspect a mini bounce could be due before the next round of losses.
Gold: Minor pullback, or the beginning of something bigger ‘going down’?
We're clearly seeing a shakeout in the gold market after it reached a record high on Monday. The question now is whether this is a minor scuffle before it continues higher or the beginning of a larger pullback.
We know that central banks are buying and geopolitical tensions are also likely to continue supporting the lust for gold. With many fundamental factors supporting gold, buyers are likely waiting for the gift of a retracement to step back into the market once the dust has settled. The trigger is likely to be weaker US economic data and renewed bets on Fed cuts.
However, gold appears to be overextended on the higher timeframes, and some mean reversion may be due. Gold is on track for its third consecutive bullish month, yet momentum is clearly waning as it tries to form a second consecutive shooting star month. The monthly RSI (2) and (14) are also in overbought territory. And with one full trading day left for the week, gold is on track for a bearish engulfing week with a bearish divergence on the RSI (2).
I’m not calling for a move below $2000, but it could comfortably reach this level without ruining the bullish trend structure on the higher timeframes. But a move to $2200 or even the $2277 lows seems feasible having looked at the clues on the higher timeframes.
Market positioning:
Futures traders have a clear bullish bias on gold, managed funds long 4.2 contracts to every short. Yet this group of traders seemed hesitant to chase prices higher since it surged from the $2000 level.
Their net-long exposure reached a 2-year high a few weeks back, and they have been slowly increasing short exposure since. I doubt they're betting on gold's collapse, but perhaps they also think gold is in need of a pullback. And I suspect a few more shorts may have been initiated this week.
However, if prices retrace lower enough, managed funds may be tempted to rejoin the party and place fresh bullish bets given the stronger fundamental backdrop for gold.
-- Written by Matt Simpson
Follow Matt on Twitter @cLeverEdge
How to trade with City Index
You can trade with City Index by following these four easy steps:
- Open an account, or log in if you’re already a customer
• Open an account in the UK
• Open an account in Australia
• Open an account in Singapore
- Search for the market you want to trade in our award-winning platform
- Choose your position and size, and your stop and limit levels
- Place the trade
Latest market news




The complete CFD trading experience
Award-winning platforms, competitive spreads, low commissions and dedicated support.
We live and breathe the markets and are dedicated to helping traders realise their ambitions as we continue to set the industry bar.
Economic calendar
Web Trader platform
Our sophisticated web-based platform is packed with features.
Related articles
EUR/USD weekly outlook: FOMC and ECB to set the tone
The current backdrop is modestly bearish. On Friday, the EUR/USD closed modestly lower, down for the third consecutive day. The pair also posted a weekly decline after staging a modest recovery attempt in the previous week. Out of the past 8 weeks, the EUR/USD has fallen on 6 occasions. There is not much supporting factors for the single currency right now. So, the upside remains capped.

S&P 500, Nasdaq, Dow Forecast: Nasdaq Selloff Deepens as Dow Rally Stalls 10 24 2026
A failed S&P breakout and looming Nasdaq support test raise the stakes for next week’s Fed decision and October’s monthly close.

Gold Does Something it Hasn’t Done in a Year, is Larger Risk-Off Afoot?
With tech stocks getting hit harder last week there was collateral damage elsewhere, including gold as the metal closed below the $4k level for the week and that’s the first time that’s happened to spot gold in more than a year.

StoneX Europe Ltd may make third party material available on this website which may contain information included but not limited to the conditions of financial markets. The material is for information purposes only and does not contain, and should not be construed as containing, investment advice and/or investment recommendation and/or an investment research and/or an offer of or solicitation for any transactions in financial instruments; any decision to enter into a specific transaction shall be made by the client following an assessment by him/her of their situation.
StoneX Europe Ltd makes no representation or warranty and assumes no liability as to the accuracy or completeness of the information provided, nor any loss arising from any investment based on a recommendation, forecast or other information supplied. You should always seek independent advice as to your suitability to speculate in any related markets and your ability to assume the associated risks, if you are at all unsure. We are not under any obligation to update any such material. Any opinion made may be personal to the author and may not reflect the opinion of StoneX Europe Ltd.