



Is USD/CAD ready to pull back?
With significant resistance above, the chance of stronger than expected inflation data, and the possibility of a “less hawkish than expected” Fed, it Is possible that the pair will move lower.
Share this:

USD/CAD reached its highest level since November 3rd, 2020 today as price continues to shoot higher, reaching an intra-day high today of 1.3344. However, is the pair ready to pull back? After a 220 pip move higher last week, USD/CAD is running into some resistance. Not only is the pair trading at the November 3rd, 2020 highs, but it is also trading right at the 50% retracement level from the pandemic highs of 1.4667 in March 2020 to the lows in May 2021, near 1.3339. In addition, USD/CAD is trading at the top trendline of an upward sloping channel that the pair has been in since March, near 1.3418.

Source: Tradingview, Stone X
With USD/CAD trading near all that resistance, what can help it to move lower? Canada releases its August CPI data Tuesday morning. Expectations are for an increase of 7.3% YoY vs a prior reading of 7.7% YoY. In addition, the Core CPI is expected to be 6.2% vs 6.1% in July. If either of these readings come in stronger than expected, USD/CAD may move lower. The US Federal Reserve also meets this week to discuss interest rate policy on Wednesday. If the Committee raises rates by less than 75bps or if it hikes with dovish comments, the US Dollar may move lower, dragging down USD/CAD with it.
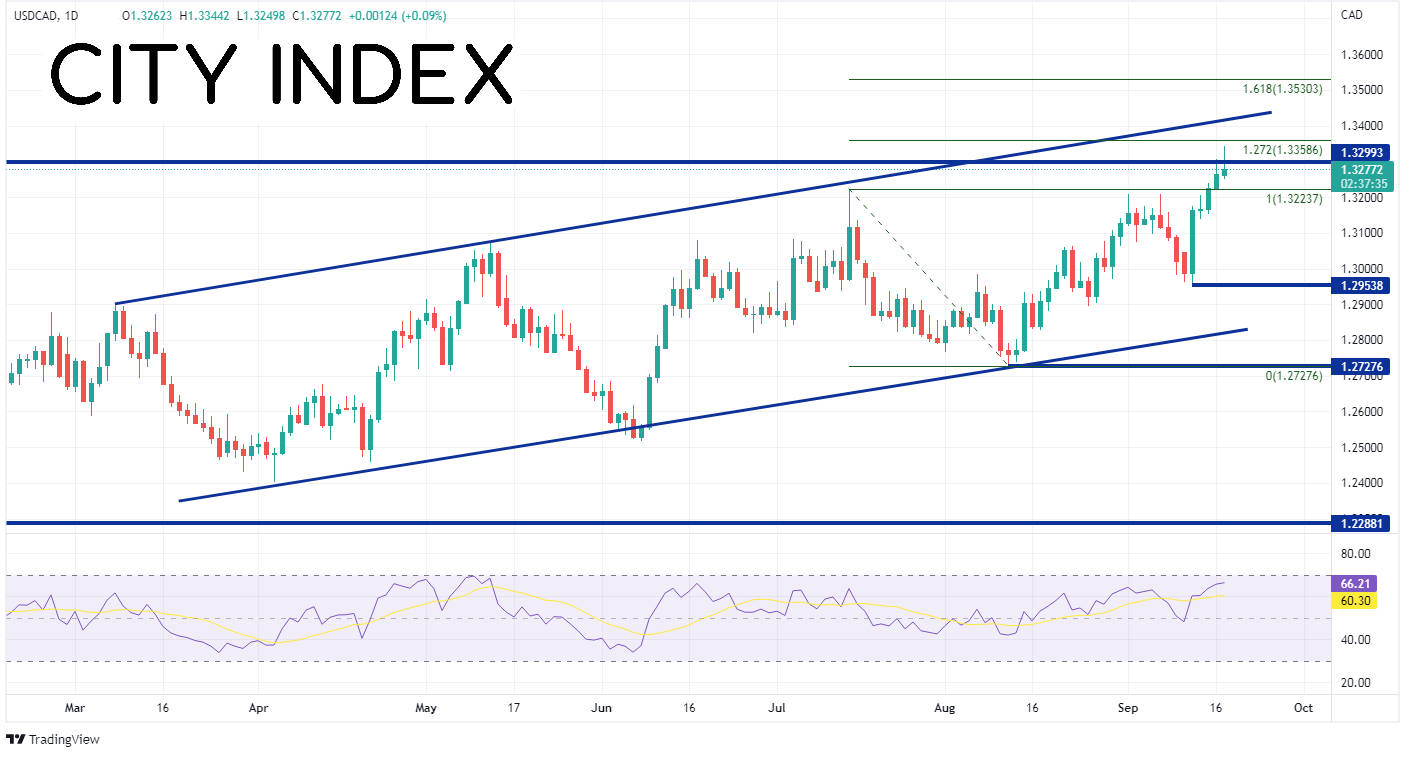
Technically, not only is USD/CAD trading with the above-mentioned resistance on the weekly timeframe, but there is also signs of pulling back on the daily timeframe. Today, price traded to just below the 127.2% Fibonacci extension from the highs of July 14th to the lows of August 11th, near 1.3359. This acts as the first resistance level (and confluences nicely with the 50% retracement level from the weekly timeframe near 1.3339). The next resistance level is the top trendline of the channel near 1.3418, then the 161.8% Fibonacci extension from the previously mentioned timeframe near 1.3530. In addition to the resistance, price has formed an inverted hammer, which indicates a possible reversal signal. If price does move lower, first support is at Friday’s low and the July 14th highs near 1.3224. Below there, price can fall to the lows of September 13th at 1.2954 and then the bottom trendline of the upward sloping channel near 1.2810.

Source: Tradingview, Stone X
Will USD/CAD reverse and move lower? With significant resistance above, the chance of stronger than expected inflation data, and the possibility of a “less hawkish than expected” Fed, it Is possible. However, if the inflation data is weaker or the Fed is uber-hawkish, USD/CAD may continue its path higher. Shorts will most likely have tight stops above today's highs.
USD/CAD reached its highest level since November 3rd, 2020 today as price continues to shoot higher, reaching an intra-day high today of 1.3344. However, is the pair ready to pull back? After a 220 pip move higher last week, USD/CAD is running into some resistance. Not only is the pair trading at the November 3rd, 2020 highs, but it is also trading right at the 50% retracement level from the pandemic highs of 1.4667 in March 2020 to the lows in May 2021, near 1.3339. In addition, USD/CAD is trading at the top trendline of an upward sloping channel that the pair has been in since March, near 1.3418.

Source: Tradingview, Stone X
Your guide to the Canadian Dollar
With USD/CAD trading near all that resistance, what can help it to move lower? Canada releases its August CPI data Tuesday morning. Expectations are for an increase of 7.3% YoY vs a prior reading of 7.7% YoY. In addition, the Core CPI is expected to be 6.2% vs 6.1% in July. If either of these readings come in stronger than expected, USD/CAD may move lower. The US Federal Reserve also meets this week to discuss interest rate policy on Wednesday. If the Committee raises rates by less than 75bps or if it hikes with dovish comments, the US Dollar may move lower, dragging down USD/CAD with it.
Everything you need to know about the Federal Reserve
Technically, not only is USD/CAD trading with the above-mentioned resistance on the weekly timeframe, but there is also signs of pulling back on the daily timeframe. Today, price traded to just below the 127.2% Fibonacci extension from the highs of July 14th to the lows of August 11th, near 1.3359. This acts as the first resistance level (and confluences nicely with the 50% retracement level from the weekly timeframe near 1.3339). The next resistance level is the top trendline of the channel near 1.3418, then the 161.8% Fibonacci extension from the previously mentioned timeframe near 1.3530. In addition to the resistance, price has formed an inverted hammer, which indicates a possible reversal signal. If price does move lower, first support is at Friday’s low and the July 14th highs near 1.3224. Below there, price can fall to the lows of September 13th at 1.2954 and then the bottom trendline of the upward sloping channel near 1.2810.
Source: Tradingview, Stone X
Trade USD/CAD now: Login or Open a new account!
• Open an account in the UK
• Open an account in Australia
• Open an account in Singapore
Will USD/CAD reverse and move lower? With significant resistance above, the chance of stronger than expected inflation data, and the possibility of a “less hawkish than expected” Fed, it Is possible. However, if the inflation data is weaker or the Fed is uber-hawkish, USD/CAD may continue its path higher. Shorts will most likely have tight stops above today's highs.
Learn more about forex trading opportunities.
Related tags:
Latest market news




The complete CFD trading experience
Award-winning platforms, competitive spreads, low commissions and dedicated support.
We live and breathe the markets and are dedicated to helping traders realise their ambitions as we continue to set the industry bar.
Economic calendar
Web Trader platform
Our sophisticated web-based platform is packed with features.
Related articles
EUR/USD weekly outlook: FOMC and ECB to set the tone
The current backdrop is modestly bearish. On Friday, the EUR/USD closed modestly lower, down for the third consecutive day. The pair also posted a weekly decline after staging a modest recovery attempt in the previous week. Out of the past 8 weeks, the EUR/USD has fallen on 6 occasions. There is not much supporting factors for the single currency right now. So, the upside remains capped.
S&P 500, Nasdaq, Dow Forecast: Nasdaq Selloff Deepens as Dow Rally Stalls 10 24 2026
A failed S&P breakout and looming Nasdaq support test raise the stakes for next week’s Fed decision and October’s monthly close.


USD/JPY Weekly Outlook: AI earnings could overshadow the Fed and BoJ
AI sentiment has become a major driver of US Treasury yields and USD/JPY. With Microsoft, Alphabet and Amazon reporting this week, central bank decisions may have competition for traders' attention.

StoneX Europe Ltd may make third party material available on this website which may contain information included but not limited to the conditions of financial markets. The material is for information purposes only and does not contain, and should not be construed as containing, investment advice and/or investment recommendation and/or an investment research and/or an offer of or solicitation for any transactions in financial instruments; any decision to enter into a specific transaction shall be made by the client following an assessment by him/her of their situation.
StoneX Europe Ltd makes no representation or warranty and assumes no liability as to the accuracy or completeness of the information provided, nor any loss arising from any investment based on a recommendation, forecast or other information supplied. You should always seek independent advice as to your suitability to speculate in any related markets and your ability to assume the associated risks, if you are at all unsure. We are not under any obligation to update any such material. Any opinion made may be personal to the author and may not reflect the opinion of StoneX Europe Ltd.