




Lloyds Tumbles To 8 Year Low As Covid Hit Is Deeper Than Expected
Lloyds share price has dived over 7% in early trade as the UK’s largest retail bank plunged into a loss in the second quarter and warned on the outlook.
Share this:

Lloyds share price has dived over 7% in early trade as the UK’s largest retail bank plunged into a loss in the second quarter and warned on the outlook.
- Lloyds reported a pre-tax loss of £676 million in Q2 compared to a pre-tax profit of £1.3 billion a year ago.
- Revenue fell -21% yoy to £3.5 billion as lower demand and lower interest rates hit income.
Bad loan provisions
Expectations were low heading towards the release of Lloyds results, but the sheer size of the amount that Lloyds is putting aside for bad loans is nothing short of worrying.
Lloyds put aside a bigger than expected £2.4 billion for bad loan provisions up from £1.4 billion in the first quarter. This impairment charge eats directly into profits. Provisions for soured mortgage loans had been excluded from Q1 but they have been included in Q2 amid fears of the impact of high levels of unemployment.
Whilst the government is supporting the labour market through the job retention scheme currently, that support will be weaned away over the coming months, which will mean that the impact of the coronavirus crisis will start to show through in rising unemployment and consequently mortgage loan default.
Larger than expected bad loan provisions have been prevalent in major banks throughout Europe with rival Barclays reporting a larger than forecast £1.6 million provision and Santander following suit.
Net Interest Income
Net interest margins, which measure the profitability of lending sunk by a whole 20 basis points to 2.59% in Q2 after the BoE slashed interest rates to 0.1% and as demand for loans and mortgages evaporates.
Outlook
As the UK’s biggest domestic bank, Lloyds is considered a bellwether for the wider UK economy. The fact that Lloyds has warned that the impact from coronavirus was worse than forecast and that the bank has adopted a gloomier outlook doesn’t bode well.
Lloyds is now modelling for a worst-case scenario of -17.2% GDP contraction this year compared to just -7.8% modelled in Q1, although the baseline case of -5% GDP contraction remains unchanged.
Dividend
Given the perfect storm that Lloyds is facing the chances of its dividend being re-instated anytime soon are looking weak at best.
Chart thoughts
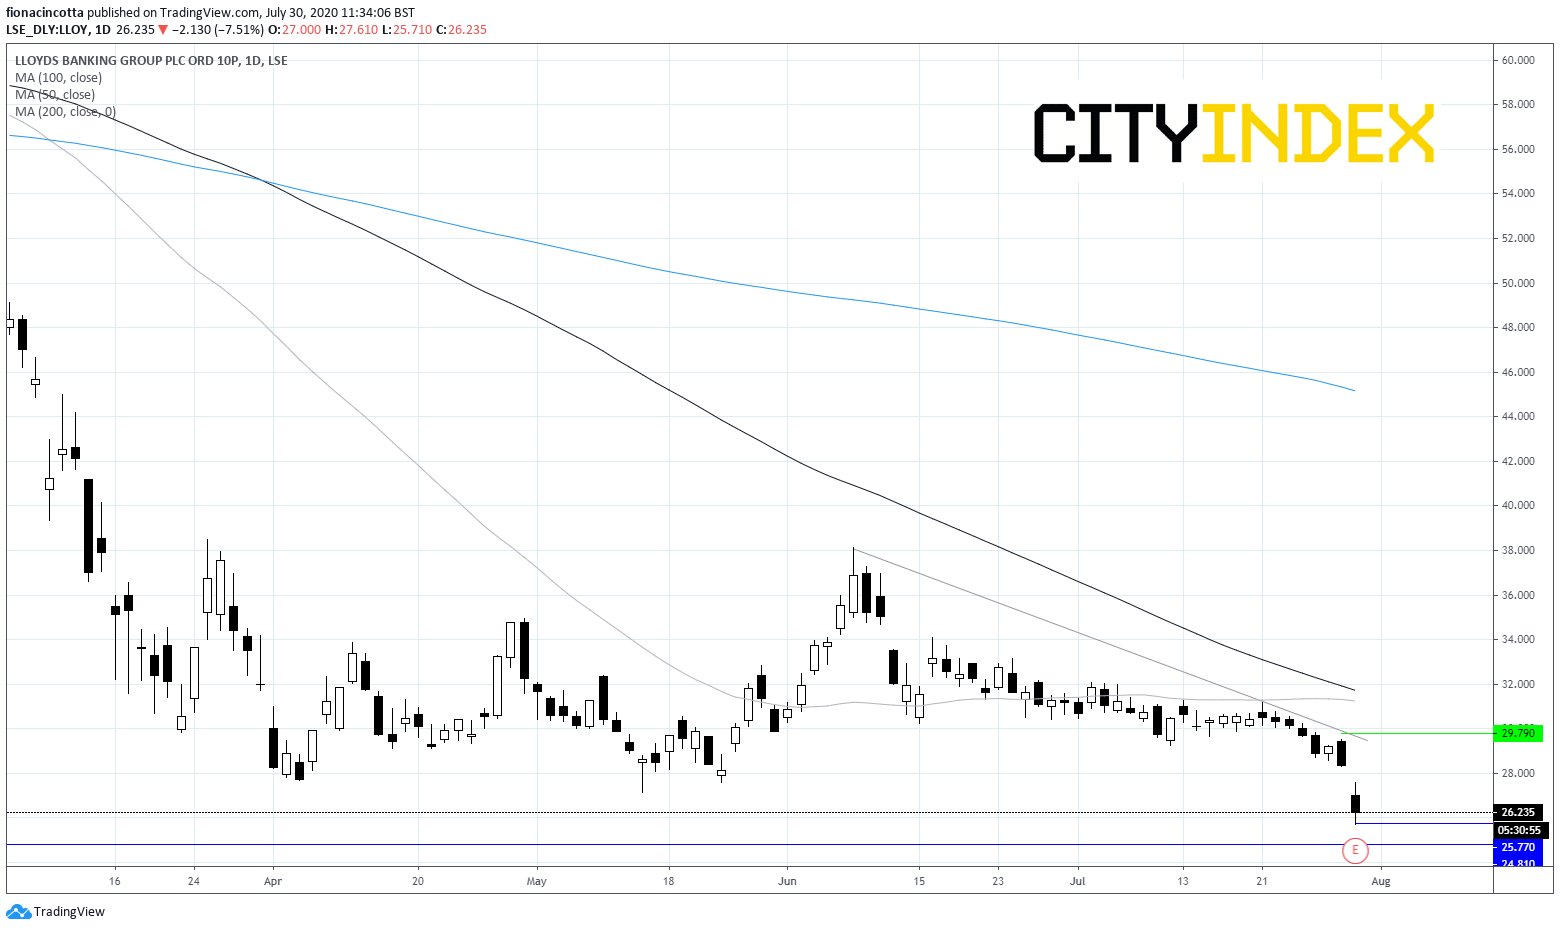
Lloyds plunged by as much as 9% on the open following the release, hitting an 8 year low of 25.7p.
The share price trades firmly below its 50, 100 and 200 daily moving averages and below its ascending trendline in a clearly bearish chart.
Immediate support can be seen at today’s low of 25.7p before 24.7p the low from May 2012.
On the flip side, a break above today’s high of 26.1p could open the door to 30p the trendline and psychological resistance level.
Lloyds share price has dived over 7% in early trade as the UK’s largest retail bank plunged into a loss in the second quarter and warned on the outlook.
• Lloyds reported a pre-tax loss of £676 million in Q2 compared to a pre-tax profit of £1.3 billion a year ago.
• Revenue fell -21% yoy to £3.5 billion as lower demand and lower interest rates hit income.
• Lloyds reported a pre-tax loss of £676 million in Q2 compared to a pre-tax profit of £1.3 billion a year ago.
• Revenue fell -21% yoy to £3.5 billion as lower demand and lower interest rates hit income.
Bad loan provisions
Expectations were low heading towards the release of Lloyds results, but the sheer size of the amount that Lloyds is putting aside for bad loans is nothing short of worrying.
Expectations were low heading towards the release of Lloyds results, but the sheer size of the amount that Lloyds is putting aside for bad loans is nothing short of worrying.
Lloyds put aside a bigger than expected £2.4 billion for bad loan provisions up from £1.4 billion in the first quarter. This impairment charge eats directly into profits. Provisions for soured mortgage loans had been excluded from Q1 but they have been included in Q2 amid fears of the impact of high levels of unemployment.
Whilst the government is supporting the labour market through the job retention scheme currently, that support will be weaned away over the coming months, which will mean that the impact of the coronavirus crisis will start to show through in rising unemployment and consequently mortgage loan default.
Larger than expected bad loan provisions have been prevalent in major banks throughout Europe with rival Barclays reporting a larger than forecast £1.6 million provision and Santander following suit.
Net Interest Income
Net interest margins, which measure the profitability of lending sunk by a whole 20 basis points to 2.59% in Q2 after the BoE slashed interest rates to 0.1% and as demand for loans and mortgages evaporates.
Net interest margins, which measure the profitability of lending sunk by a whole 20 basis points to 2.59% in Q2 after the BoE slashed interest rates to 0.1% and as demand for loans and mortgages evaporates.
Outlook
As the UK’s biggest domestic bank, Lloyds is considered a bellwether for the wider UK economy. The fact that Lloyds has warned that the impact from coronavirus was worse than forecast and that the bank has adopted a gloomier outlook doesn’t bode well.
As the UK’s biggest domestic bank, Lloyds is considered a bellwether for the wider UK economy. The fact that Lloyds has warned that the impact from coronavirus was worse than forecast and that the bank has adopted a gloomier outlook doesn’t bode well.
Lloyds is now modelling for a worst-case scenario of -17.2% GDP contraction this year compared to just -7.8% modelled in Q1, although the baseline case of -5% GDP contraction remains unchanged.
Dividend
Given the perfect storm that Lloyds is facing the chances of its dividend being re-instated anytime soon are looking weak at best.
Given the perfect storm that Lloyds is facing the chances of its dividend being re-instated anytime soon are looking weak at best.
Chart thoughts
Lloyds plunged by as much as 9% on the open following the release, hitting an 8 year low of 25.7p.
The share price trades firmly below its 50, 100 and 200 daily moving averages and below its ascending trendline in a clearly bearish chart.
Immediate support can be seen at today’s low of 25.7p before 24.7p the low from May 2012.
On the flip side, a break above today’s high of 26.1p could open the door to 30p the trendline and psychological resistance level.
Related tags:




The complete CFD trading experience
Award-winning platforms, competitive spreads, low commissions and dedicated support.
We live and breathe the markets and are dedicated to helping traders realise their ambitions as we continue to set the industry bar.
Economic calendar
Web Trader platform
Our sophisticated web-based platform is packed with features.
Related articles

Klarna IPO 2025: Key Facts, Valuation & BNPL Outlook
Klarna’s long-awaited IPO lands with a ~$14B valuation target—well below its 2021 peak but far above its 2022 trough. With 111M users, ~790k merchants, and five straight profitable quarters, Klarna hopes to prove it’s more than just a BNPL pioneer. Our cheat sheet breaks down the company’s history, valuation, competitors, revenues, and what to watch as KLAR lists on the NYSE in the busiest IPO week since 2021.


JPMorgan Q4 Earnings: Growth, Risks, and Outlook
JPMorgan Chase releases Q4 earnings on Jan 15, with EPS expected at $4.03 and revenue at $41.58B. Analysts will watch net interest income, cost control, and credit provisions as rising rates boost profits but risks like delinquencies and geopolitical tensions persist. The bank has outpaced the S&P 500 in 2025 YTD, reflecting resilience. Will it maintain its streak of beating estimates? Learn about its growth drivers, risks, and market impact ahead of this pivotal report.
Earnings preview: Bank of America, Goldman Sachs & Citigroup
US financial services and banks continue to release earnings. All of them reported higher earnings numbers when compared to last year. We continue with 4 more.
StoneX Europe Ltd may make third party material available on this website which may contain information included but not limited to the conditions of financial markets. The material is for information purposes only and does not contain, and should not be construed as containing, investment advice and/or investment recommendation and/or an investment research and/or an offer of or solicitation for any transactions in financial instruments; any decision to enter into a specific transaction shall be made by the client following an assessment by him/her of their situation.
StoneX Europe Ltd makes no representation or warranty and assumes no liability as to the accuracy or completeness of the information provided, nor any loss arising from any investment based on a recommendation, forecast or other information supplied. You should always seek independent advice as to your suitability to speculate in any related markets and your ability to assume the associated risks, if you are at all unsure. We are not under any obligation to update any such material. Any opinion made may be personal to the author and may not reflect the opinion of StoneX Europe Ltd.