


Nasdaq 100 forecast: Nvidia troubles put AI recovery into question
The recovery for major indices this week has helped repair much of the technical damage inflicted by last week’s sell-off, but the latest developments with Nvidia suggest investors are not quite ready to put the underlying risks behind them. The Nasdaq 100 led other US index futures lower overnight, with falls of around 0.8%.
Share this:

The recovery for major indices this week has helped repair much of the technical damage inflicted by last week’s sell-off, but the latest developments with Nvidia suggest investors are not quite ready to put the underlying risks behind them. The Nasdaq 100 led other US index futures lower overnight, with falls of around 0.8%. Reports alleged that Huang had been involved in a relationship with an NVIDIA executive, with reports also suggesting that the company’s board was considering his future. The news introduced fresh uncertainty around one of the most influential figures in the AI industry, although the longer-term implications for NVIDIA and the wider sector remain unclear. We maintain a cautious Nasdaq 100 forecast in these circumstances.
Nvidia Chief allegations trigger fresh selling
US equity futures turned lower overnight as technology shares faced a fresh distraction following reports concerning NVIDIA chief executive Jensen Huang. Allegations published by the New York Times and Wall Street Journal introduced uncertainty around one of the most influential figures in the AI industry, with the latter also reporting that the company’s board was considering his future. The implications remain unclear, but the headlines added fresh uncertainty to an already closely scrutinised sector. Nvidia stock price fell more than 7% in premarket.
This week has seen the Nasdaq and other US and European indices stage a strong recovery. US technology stocks extended their rebound on Wednesday, helping the tech-heavy index outperform its peers. Strong results from CoreWeave, whose shares surged more than 20% in after-hours trading following its earnings announcement, provided a welcome boost to sentiment. The recovery also lifted other so-called neocloud stocks, although attention is now turning to Nebius’ results on Thursday for further evidence that demand for AI infrastructure is translating into sustainable growth.
But with Nvidia falling again, let’s see if that bullish momentum in tech will come to an end today.
Underlying AI concerns have not disappeared
As mentioned, the rebound this week has allowed the major US indices to claw back much of last week’s losses, when concerns about the political implications of the Democrats’ sweeping midterm victory triggered a sharp deterioration in risk appetite. With Democrats now controlling both chambers of Congress, the prospect of tighter scrutiny of AI development, Big Tech and the enormous investment flowing into data centres is becoming harder for investors to dismiss. So far, they have been keen to buy the dips as we have seen. But with the markets now back at pre midterms levels, I wouldn’t be surprised to see fresh selling again.
That does not necessarily mean the sector is heading for a major sell-off. However, it does leave technology stocks vulnerable to bouts of profit-taking, particularly given the extraordinary gains accumulated over recent years and the increasingly demanding expectations built into valuations.
There is also a more fundamental question hanging over the AI trade: whether the billions of dollars being committed to infrastructure will ultimately generate returns commensurate with the scale of investment. Strong earnings from companies such as CoreWeave can help reassure investors, but the market will need more than isolated positive surprises to establish that the current spending cycle is sustainable.
Nasdaq 100 forecast: Technical analysis and levels to watch
The Nasdaq 100 has recovered much of the technical damage inflicted last week, particularly during Thursday’s sharp sell-off, with the major US indices staging a fairly convincing rebound.
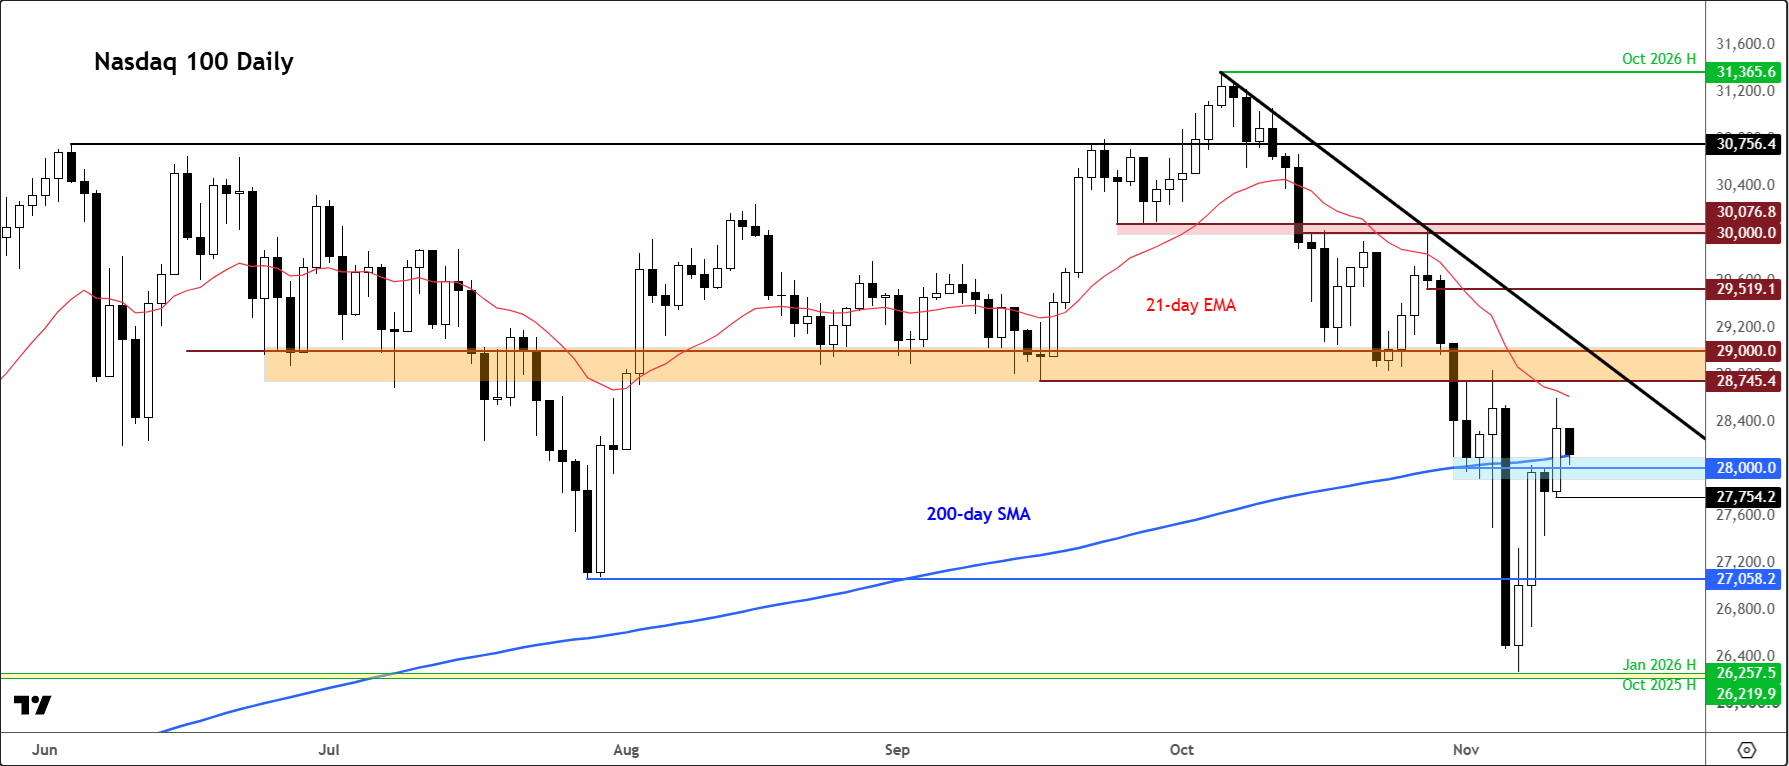
Looking at our US Tech 100 chart, which is based on Nasdaq 100 futures, the recovery began from precisely the area where it needed to: the 26,200–26,260 region, which provided support towards the end of last week. This is a technically significant zone, having marked a previous double top formed in October and January. The market eventually broke above this area in April and, until last Friday, had not returned to retest it. The fact that former resistance has now acted as support is encouraging.
The index has also reclaimed its 200-day moving average and moved back above the broken summer lows around 27,060. Both are positive developments and suggest that buyers are regaining some control. However, it is still too early to declare the correction over or assume that the market is ready to push towards fresh record highs.
For that to happen, the Nasdaq needs to overcome the sequence of lower highs established since its October peak. There is also the 21-day exponential moving average converging with key resistance around 28,745–29,000. This is therefore the next major resistance area to watch. A sustained break above it would significantly improve the technical outlook and provide a stronger signal that the recovery has further room to run.
On the downside, the 200-day moving average and the 28,000–28,100 area are important levels to monitor. A move back below this region would suggest that the recent rebound is beginning to lose momentum. More immediately, yesterday’s low at 27,755 is an important short-term support level. A break below it would raise questions about the sustainability of the latest bullish move and increase the risk that the recovery was little more than a false breakout.
Should buyers manage to clear the 28,745–29,000 resistance zone, the next upside objective comes in around 29,520, marking the base of the breakdown towards the end of October. Beyond that, the psychologically important 30,000 level would come into focus.
For now, the price action is encouraging, not just in the Nasdaq 100 but across the wider equity market. The strength of the rebound should not be dismissed. Nevertheless, there are still plenty of macroeconomic uncertainties capable of unsettling sentiment, and the technical picture has yet to provide an outright bullish confirmation.
The key is to remain nimble, respect the important support and resistance levels, and manage risk accordingly. A strong rebound does not necessarily mean the worst is over, and markets have a habit of reminding investors of that when they least expect it.
In summary
The Nasdaq 100 forecast remains mixed. It has made a decent recovery following last week’s sharp decline. The ability of buyers to step in around key support suggests that underlying demand remains reasonably healthy, although the index still needs to demonstrate that this is more than a temporary rebound. For now, the picture is one of improving technical momentum but unresolved fundamental risks. The latest rebound has bought technology bulls some breathing space, rather than conclusively removing the reasons behind last week’s sell-off.

Related tags:


The complete CFD trading experience
Award-winning platforms, competitive spreads, low commissions and dedicated support.
We live and breathe the markets and are dedicated to helping traders realise their ambitions as we continue to set the industry bar.
Economic calendar
Web Trader platform
Our sophisticated web-based platform is packed with features.
Related articles
Nasdaq 100 forecast: Nvidia troubles put AI recovery into question
The recovery for major indices this week has helped repair much of the technical damage inflicted by last week’s sell-off, but the latest developments with Nvidia suggest investors are not quite ready to put the underlying risks behind them. The Nasdaq 100 led other US index futures lower overnight, with falls of around 0.8%.

Bitcoin Selloff Deepens as Midterm Sweep Stalls Crypto Bill
The Bitcoin selloff is being driven by hot U.S. inflation data, a Democratic midterm sweep that stalls the CLARITY Act and heavy ETF outflows.

What UK GDP Means for GBP/AUD After a Key Resistance Break
The GBP/AUD breakout follows a Reserve Bank of Australia rate hike paired with a signal of a prolonged pause, draining support from the Aussie.
StoneX Europe Ltd may make third party material available on this website which may contain information included but not limited to the conditions of financial markets. The material is for information purposes only and does not contain, and should not be construed as containing, investment advice and/or investment recommendation and/or an investment research and/or an offer of or solicitation for any transactions in financial instruments; any decision to enter into a specific transaction shall be made by the client following an assessment by him/her of their situation.
StoneX Europe Ltd makes no representation or warranty and assumes no liability as to the accuracy or completeness of the information provided, nor any loss arising from any investment based on a recommendation, forecast or other information supplied. You should always seek independent advice as to your suitability to speculate in any related markets and your ability to assume the associated risks, if you are at all unsure. We are not under any obligation to update any such material. Any opinion made may be personal to the author and may not reflect the opinion of StoneX Europe Ltd.